Data Visualization
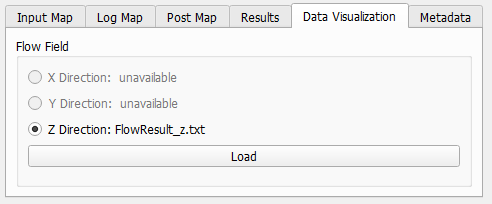
The fifth tab contains the setup for the Data Visualization. Flow fields that have been calculated to determine the flow resistivity values can be visualized by clicking Load.
The options for the visualization of flow results are explained in detail in the GeoDict Visualization handbook.