Results
Generating a Gaussian random field produces a GeoDict result file (*.gdr) and a result folder with the same name. Both are saved in the chosen project folder (File → Choose Project Folder… in the menu bar).
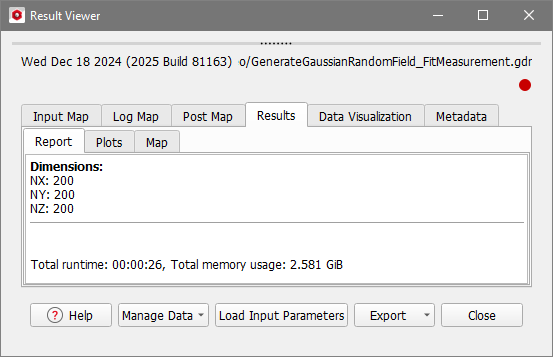
The GeoDict Result Viewer opens for the result file and in the Results – Report subtab find the dimensions of the generated field.
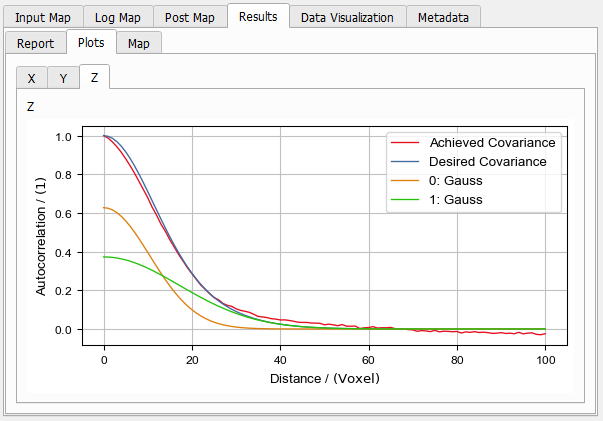
View the achieved covariances for the three dimensions in the Plots subtab of the Results tab. The red graph shows the Achieved Covariance in the resulting Gaussian random field. The blue plot shows the Desired Covariance which is the Generator Input prepared in the Gaussian Random Field Generator. How many numbered plots appear depends on the settings in the generator dialog. Here, the desired covariance is the sum of two Gauss functions.
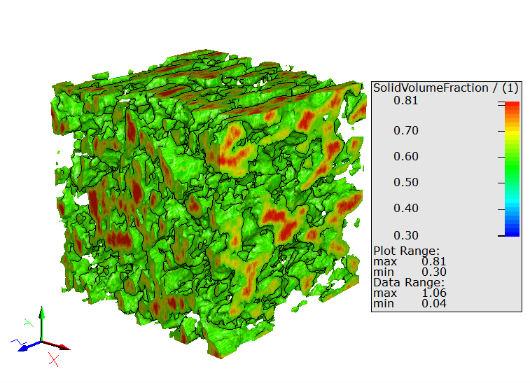
The Gaussian Random Field is visualized in GeoDict after the generation but can also be loaded at any time from the Result Viewer. In the Data Visualization tab click Load Gaussian Random Field and in the Loading Volume File dialog click OK.
To learn more about visualization in GeoDict, refer to the Visualization handbook.
This volume field can be transformed into a structure by right-clicking on the field in the Project Status and selecting Threshold to Structure.
For one threshold, the resulting structure can be previewed in 3D.
Edit the parameters as desired, and click Run.
