Data Visualization
Under the Data Visualization tab, the .gdt and .hht files, corresponding to the saturation levels computed, can be opened, as explained in the ConductoDict handbook. No files are available if Discard PDE Solver Files was checked in the Solver settings tab.

For each selected Computational Direction the solution files for the saturation steps with non-zero conductivity are saved and can be loaded by clicking on the Load .gdt and .hht button.
In the structure file (.gdt) you can observe the fluid distribution, while the .hht (homogenized heat) file contains the temperature values at each voxel.
Select Structure to load the original structure which is saturated with the displaced fluid. No additional .hht file will be loaded.
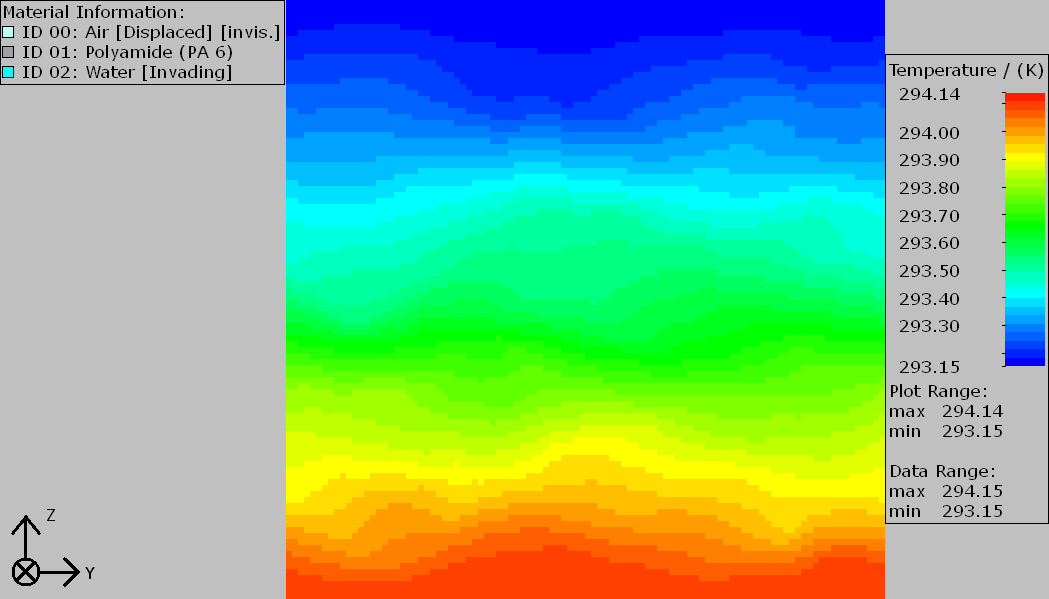
Shown below is the .gdt file for a 25% invading fluid saturation level. The right part of the image shows the temperature field with transparent effect on the clipped structure model.

An Alternative is to change to the 2D cross-section view (View → Structure in the menu bar) and to switch off the visualization of the structure and the transparent effect for the volume field. Observe how the heat is distributed in the structure.
More information about the visualization parameters is available in the Visualization handbook.
