Visualization of Deposited Dust
Visualize the Deposited Dust
In the Result Viewer, under the Particle Visualization tab, in the Deposited Dust panel, choose the Time Step of interest, and click Load Deposited Dust.
The visualization settings can be chosen under the Volume Field tab in the visualization panel. In the figure, Threshold by Fraction is selected to show only areas where a voxel is filled by more than 1% (pull-down menu set to >= and slider moved to 0.01). Unchecking Smooth shows every voxel with it’s individual color without any interpolation and surface smoothing.
To see also the dust accumulation inside of porous materials, either switch off the visualization of the structure completely, or turn the rendering in the Structure tab to transparent.
For more information about the visualization option, see the Visualization handbook.
Load the Deposited Dust as Voxel Structure
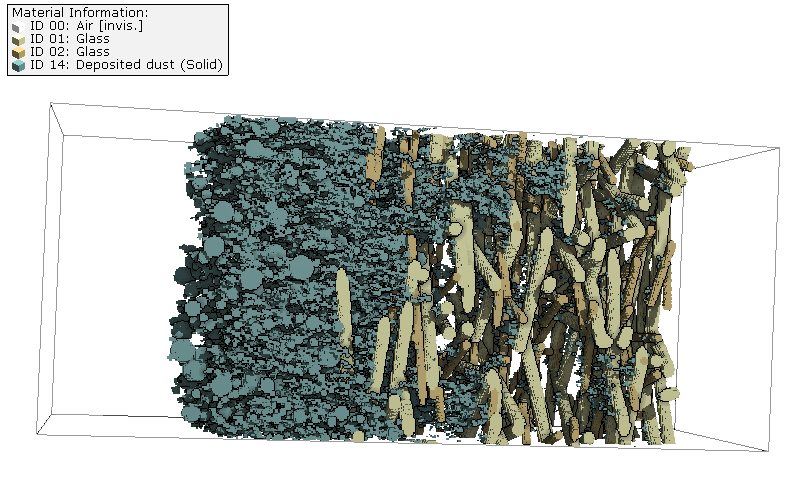
In the Result Viewer, under the Particle Visualization tab, in the Deposited Dust panel, choose the Time Step of interest, and click Load Deposited Dust as Voxel Structure.
To convert the double valued 3D field stored inside the .gvf file into a structure, a conversion threshold is needed, and must be entered by the user. Enter a value between 0 and 1 here.
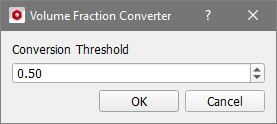
All voxels filled by at least the entered fraction will be turned into a solid material with Material ID 14.
Visualize the Deposited Dust Age
In the Result Viewer, under the Particle Visualization tab, in the Deposited Dust panel, click Load Deposited Dust as Voxel Structure.
The visualization settings can be chosen under the Volume Field tab in the visualization panel. In the figure, select Threshold by Age, set the pull-down menu set to and move the slider to 0. Uncheck Smooth to see every voxel with it’s individual color without any interpolation and surface smoothing.
The imported data contains the deposited dust at the end of the simulation, it is not possible to load intermediate time steps. The value in each voxel denotes the time that has passed since the voxel was filled. In the picture below, particles that entered the filter first are colored red, particles that entered last are colored blue.