Visualization of Particle Movement
The Particles visualization tab is automatically enabled when trajectories or final particle positions are loaded. You can visualize the movement of a particle when you have loaded its complete trajectory. If you have loaded only the final position of a particle, the movement is not visualized, but it will appear at its final position.
The most important settings for the particle visualization can be accessed through the Particles tab. Additional visualization settings are opened by clicking the gear icon  on the bottom right of the visualization panel in the GeoDict GUI. The Visualization Settings → Data View → Particles menu contains the complete list of all available visualization parameters.
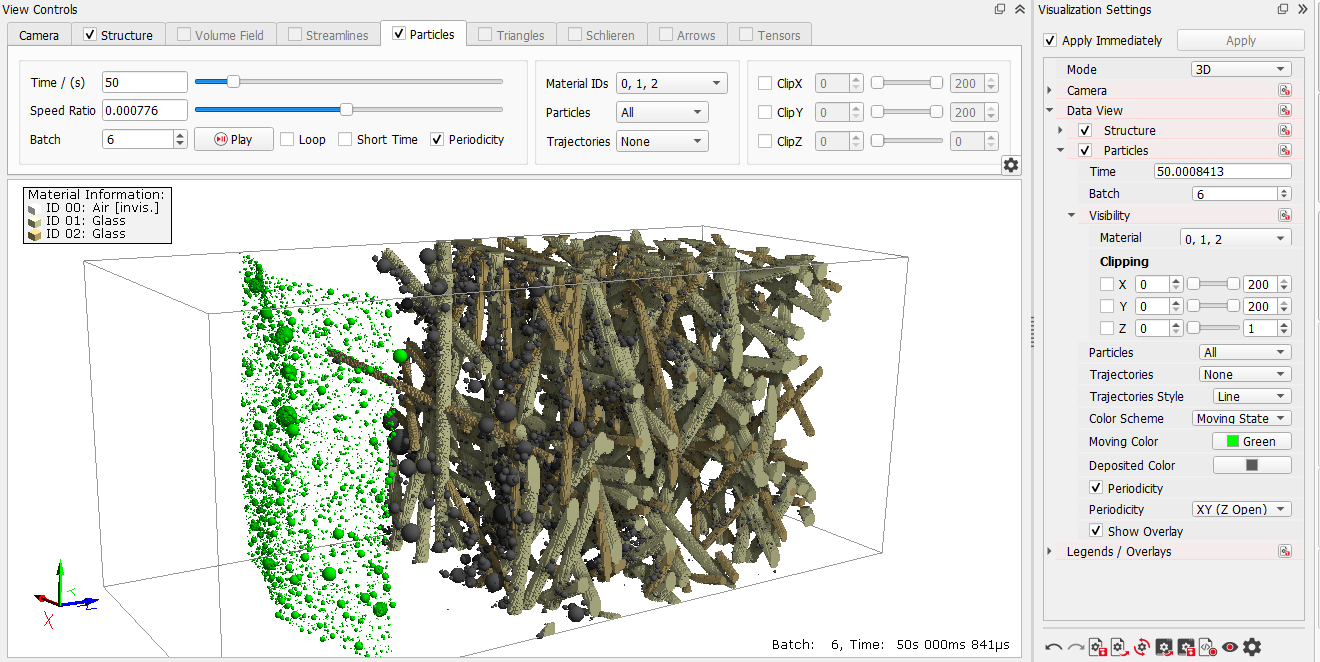
The Particle Visualization Tab
The sliders for Time and Speed ratio control the visualization of the particle movement. Moving the slider or directly entering a Time allows displaying the particles at a given moment in time.
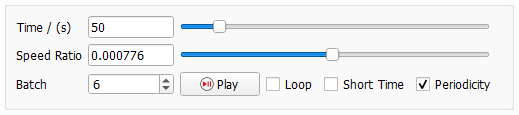
The Speed ratio (Simulated Time (ms)/Real Time (s)) controls the visualization speed by entering values directly or by moving the slider.
The animation of the particles starts by clicking Play. The Batch number changes from the first loaded batch to the last loaded batch. It is also displayed at the bottom-right of the viewport.
The Time slider does not return to zero when the animation has finished and must be set to the initial value to restart the animation. Checking Loop makes the slider return to zero and the animation is played endlessly.
If the simulation was done with periodic boundary conditions, Periodicity should be checked to animate the particles with periodic boundary conditions, too. This way, particles which leave the domain at one side re-enter at the opposite side.
Checking Short Time adapts the visualization Time to the period when most particles move. In each batch, this option cuts off the final part of the simulation where only a few particles move at very low velocities and virtually no changes are visible.
In the center panel, select which particles and trajectories are shown.
The Material ID selector allows to select in which materials the particle movement should be shown. This is useful if porous materials are present in the structure and you want to visualize only those particles that move inside of a specific material. If the constituents consist only of one fluid domain and solid materials (e.g. air and glass fibers), then particle movement will be solely inside of the fluid domain (air).
The Particles and the Trajectories pull-down menu can be set to:
- None to show no particles.
- Filtered to show only the filtered particles.
- Not Filtered to only show the particles that are not filtered.
- Time Out to display only particles whose movement could not be simulated completely within the current time interval (batch).
- All to show all particles.
- Custom to show a user-defined selection of particles. Specify the selection in the Custom Particles dialog. The customized selection applies to both particles and trajectories visualization.
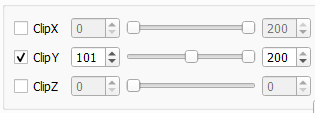
In the panel on the right hand side, you can clip the volume in which particles and trajectories are visualized. Check the button in front of the line and move the sliders to the desired position. Particles and trajectories will only be shown inside of this volume.
The Visualization Settings Panel
The Visualization Settings panel contains all parameters accessible in the Particle visualization tab and some more. Open the Visualization Settings → Data View → Particles menu to access them.
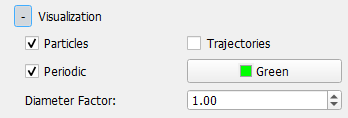
Here, you can change the Trajectories Style from Line (default) to Stippled.
Control the Color Scheme by selecting between the following options from the pull-down menu:
- Moving State: If selected the default green color of the non-filtered particles can be changed with the parameter Moving Color. The color of the filtered particles can also be changed from the default dark gray with Deposited Color.
- Material: The colors are selected automatically depending on the material.
- Size: The colors are selected automatically depending on the particle size. Particles are colored from blue (small particles) to red (large particles).
- Batch ID: The colors are selected automatically depending on the batch ID. Particles are colored from blue (deposited in first batch) to red (deposited in last batch.
- Residence Time: The colors are selected according to the time spent in the chosen Materials.
- Bounces: The colors are selected depending on the number of bounces from the selected Materials.
- Entries: The colors are selected depending on how often the particles enter the chosen Materials.
- Trapped: The colors are selected depending on the material they are trapped in.
Uncheck Show Overlay to remove the batch and time displayed at the bottom right of the viewport.
Customized Visualization of Particles
If Custom is chosen for the visualization of the particles, settings for a user-defined, customized visualization can be defined by clicking the Edit Custom… button. Alternatively, the same dialog can be accessed by clicking Open Custom Particle Dialog in the Visualization Settings panel.
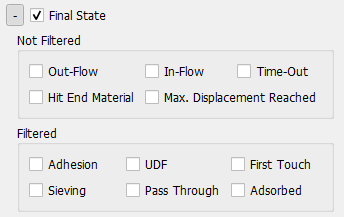
The Custom Particle Selection dialog opens. Clicking Add Selection generates Selection 1. Clicking  at the left of Selection 1 opens the options: Previous Batches, Diameter Selection, ID Selection, Type ID Selection Final State, Deposition Zone, Multiplicity, and Visualization. Parameters for all these options are accessed by clicking on their
  symbol.
Clicking Add Selection again adds a new selection (e.g., Selection 2), which allows combining different selection models and is useful to distinguish e.g., particles with two different diameter ranges (Diameter Selection). Clicking Remove deletes the selection.
The Custom Particle Selection dialog may remain open to observe the changes that the selections have on the visualization of particles moving through the structure. The custom particle options can be changed while the particle animation is playing, so that the effect of the selection can be observed immediately.
 Previous Batches
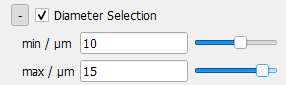
Diameter Selection
ID Selection
Type ID Selection
Deposition Zone