Results
The result file (*.gdr) is opened in the Result Viewer after the computation is finished.
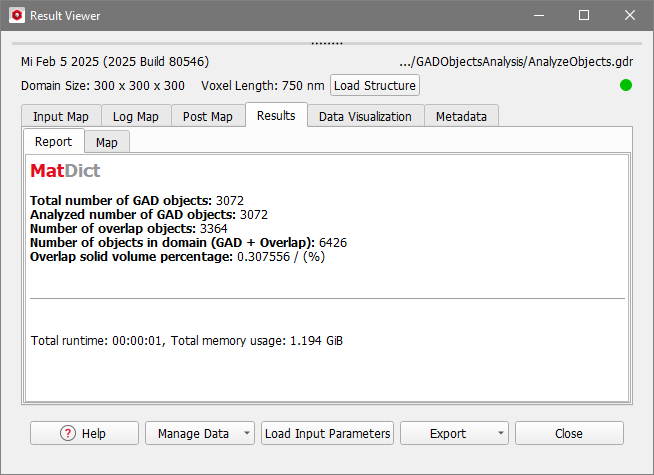
In the Results - Report subtab, the following values are reported:
- Total number of GAD objects is the number of all objects present in the 3D structure.
- Analyzed number of GAD objects is the number of objects considered in the analysis. This number is different from the above number if Analyze Selected Material ID was chosen. In this case only the number of GAD objects of the selected Material ID is reported here.
- The Number of overlap objects counts how many overlaps between GAD objects are present in the structure.
- The Number of objects in domain (GAD + Overlap) is the sum of the total number of GAD objects and the number of overlap objects inside the current domain. It is possible that some objects lie completely outside of the domain, and in this case, they are not counted here.
- Overlap solid volume percentage is the volume fraction of the overlap objects.
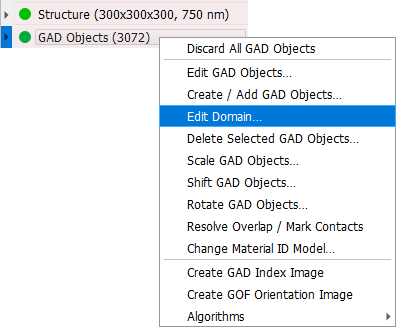
The resulting numbers depend on the way overlapping objects are treated. How overlap is handled is typically defined at the creation of the structure but can also be modified later using the Edit Domain command from the GAD Objects context menu in the status section.
Results if Analyze Object Contact was checked
If Analyze Object Contact was checked in the Analyze Options tab, the total number of contacts and the mean coordination number are additionally reported in the Contact section of the report.
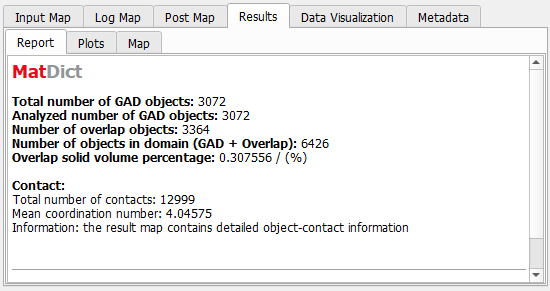
Here, the Mean Coordination Number is defined as:
More detailed results for all contacts are available under the Results - Map subtab:
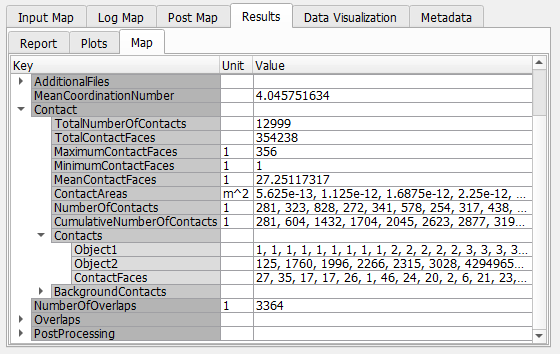
Under the Contacts key, for each contact the index numbers of both objects and the number of contact faces are given. In the above example, the first contact is between object number 1 and object number 125 and has a size of 27 voxel faces. The second contact is between object number 1 and object number 1760 and has a size of 35 voxel faces.
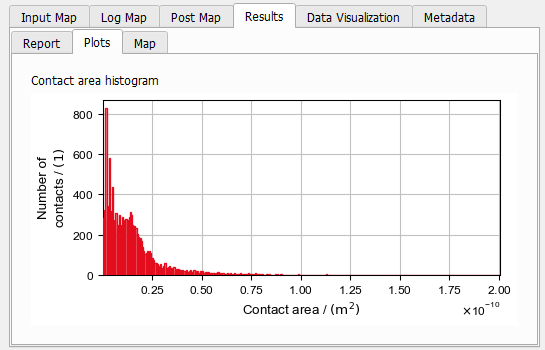
Under the Results - Plots subtab, the Contact Area Histogram visualizes the size distribution of the contact areas:
Results if Analyze Object Volume was checked
If Analyze Object Volume was checked in the Analyze Options tab, the minimal, maximal, and mean volume are stated in the Object Volume section.
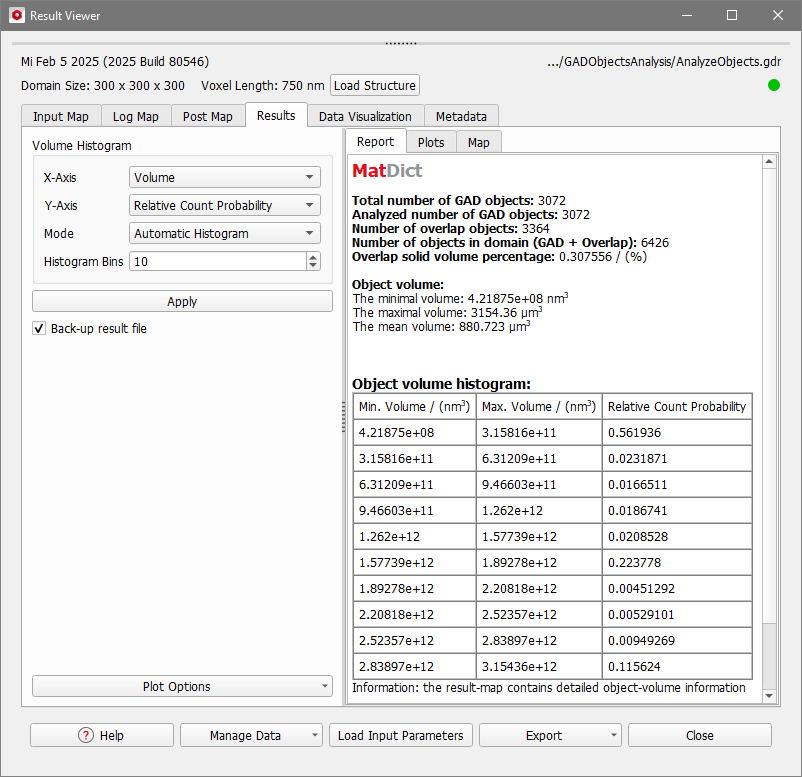
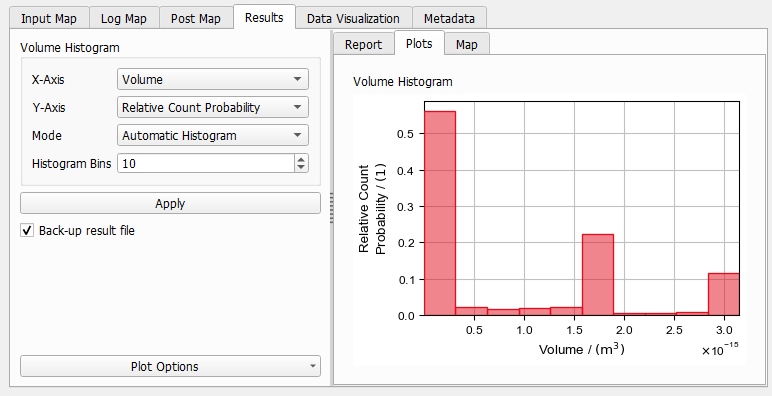
Furthermore, an Object volume histogram table is plotted based on the Volume Histogram settings defined in the options tab. You can edit the volume histogram afterwards in the post-processing panel on the left-hand side of the Report tab.


The object volume histogram is graphically shown under the Result - Plots subtab. In the plot, the values for each bin are visualized as bars. The table and plot update when you click the Apply button after changing the Volume Histogram input parameters.
More parameters can be defined by clicking Plot Options at the bottom of the panel and choose Edit Axis Settings or Edit Graph Styles for the desired plot. See also Plots in Result Files in the Result Viewer handbook for detailed explanations.