Results
The result file (*.gdr) is shown in the Result Viewer after the computation is finished.
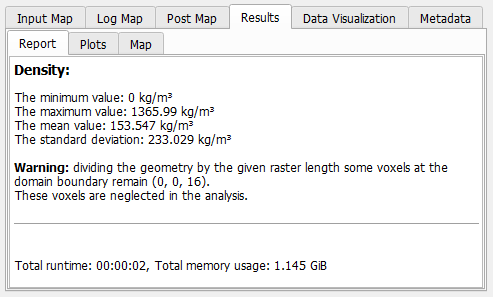
In the Results - Report subtab, the minimal and maximal value of the chosen property found in any sub-volume are reported. Additionally, the mean value and the corresponding standard deviation are shown.
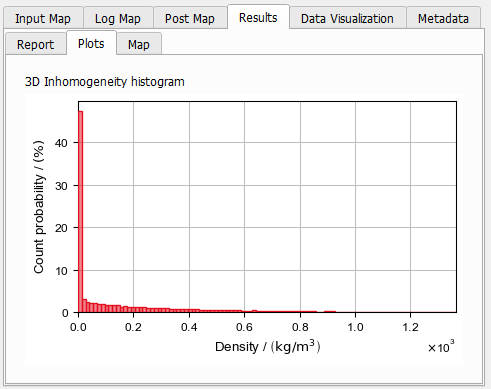
In the Results – Plots subtab, the histogram of the Count Probability of the selected property is plotted.