Results
The result file (*.gdr) is opened in the Result Viewer after the computation is finished.

The results of the relative diffusivity calculated on a partially saturated porous material with 17% porosity (83% SVF) are shown. The Invading Phase was selected as the flow phase (Wetting Parameters tab), and diffusivity was calculated in Z-direction with Dirichlet boundary conditions (Boundary Conditions tab). Computations were run using the LIR solver.
Report tab
Under the Results-Report sub-tab, the Relative Diffusivity (dimensionless saturation-dependent diffusivity) table is shown for the chosen saturation rates (here, 0, 0.25, 0.50, 0.75, and 1), which are approximated as best as possible (here, 0, 0.250136, 0.489804, 0.753896, and 1).
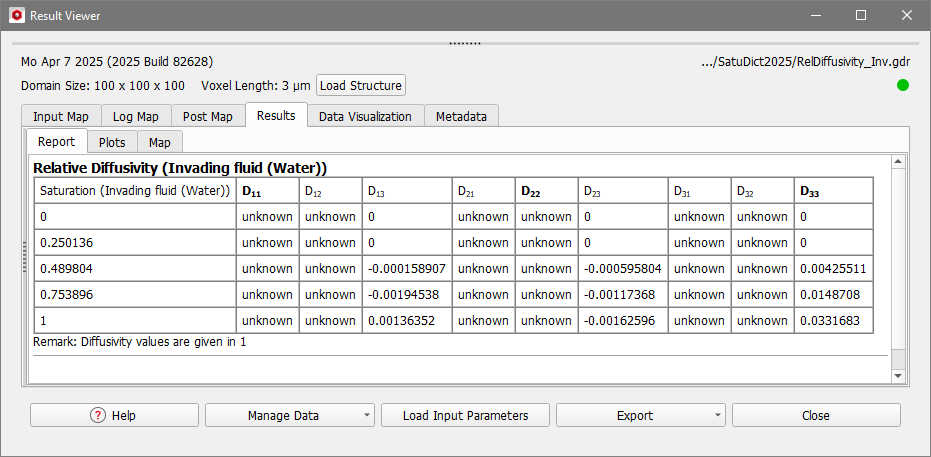
For the selected Flow Phase the saturation-dependent relative diffusivity of the fluid is shown in the table, where each row stands for one saturation level. The values of the whole diffusivity tensor at each saturation step are given in the columns. For directions which were not selected as Computational Direction the diffusivity value is unknown.
In the example above, the entries , , for the computation in Z-direction are given, the other values are unknown as the computations were not carried out.
|
Know how! In the example above, the relative diffusivity at 0% and 25% invading fluid saturation is zero in Z-direction, indicating that before the structure is 49% saturated with the invading fluid, there is no path for the invading fluid. |

Plots tab
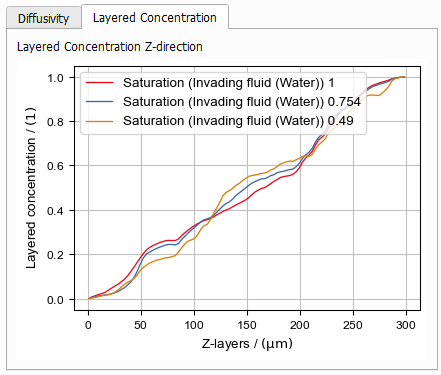
In the Results-Plots subtab, the values of the Relative Diffusivity table are shown in a graph. Also, the Layered Concentration in the computed directions is given.
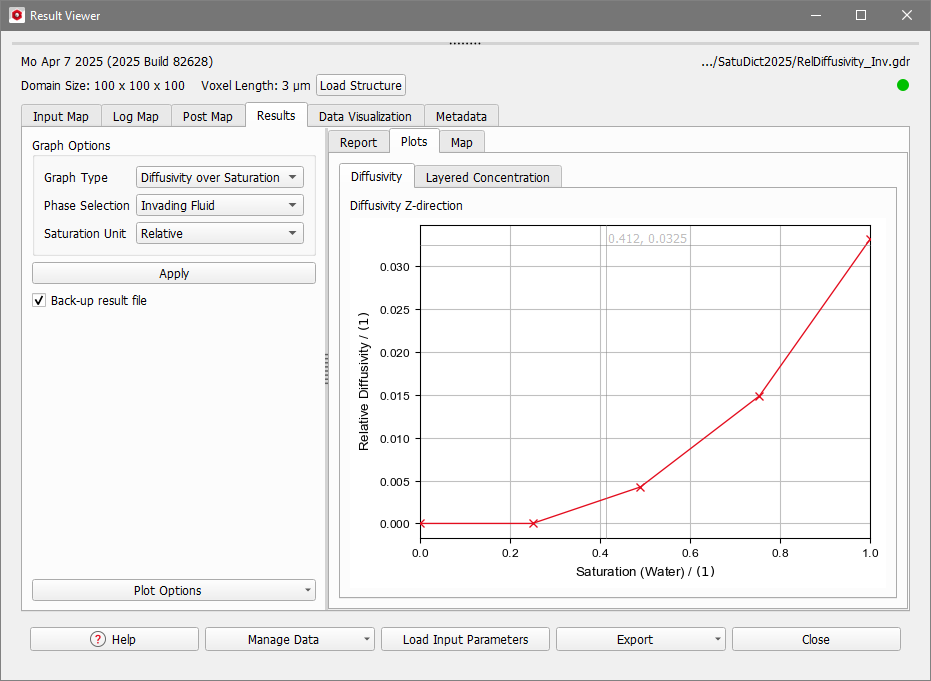
Diffusivity Plot
The values of the diffusivity in all selected Computational Directions and for the selected Flow Phase at the different saturation levels are shown in a graph.
On the left, the Post-Processing Widget allows you to fine-tune the Diffusivity plot. Collapse the Post-Processing Widget by pulling it to the left.

Layered Concentration
In the Layered Concentration tab for each computational direction the concentration in each layer is shown in a graph. The settings made under the Graph Options do not apply for these plots, but the axis settings and graph styles can be changed under Plot Options.