Arrows
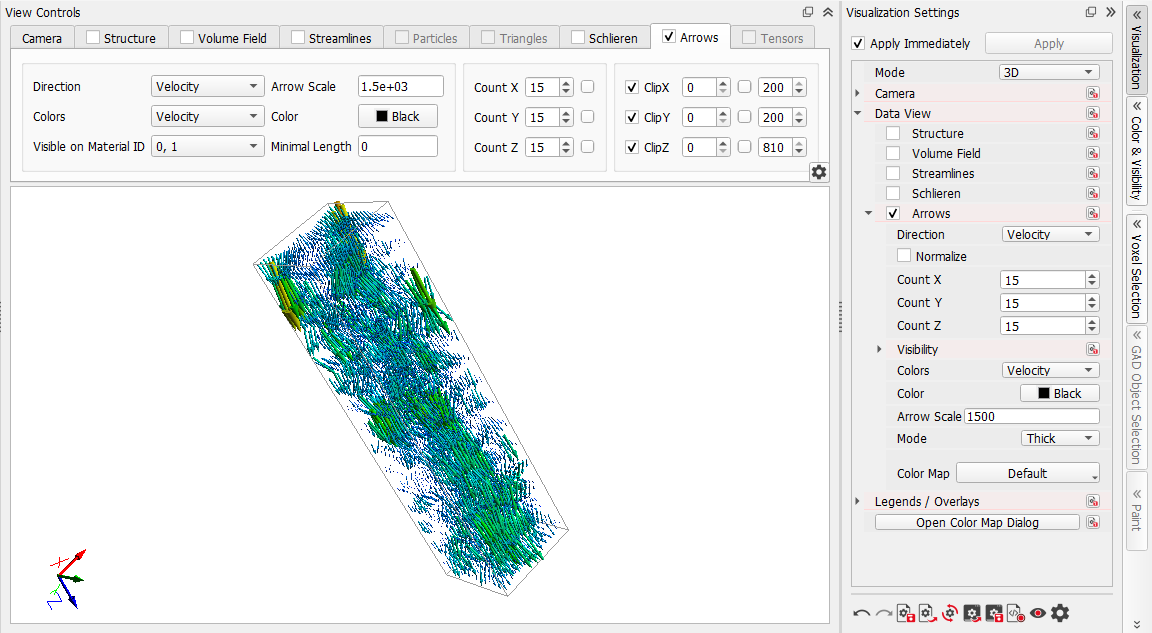
One flow field visualization option is representing the volume field by an arrow field.
Here, the properties of the fluid flow field are imaged at all positions of a regular grid that do not belong to the solid. At each of these positions, the local orientation of the flow field is indicated by a vector and its length and color are coded for the fluid velocity. Small vectors indicate a slow fluid velocity and long vectors indicate a high fluid velocity. Vectors are located with their middle in the center of the voxel for which they represent the flow velocity.
The Arrows tab controls the visibility of the arrows. Some additional options and all the options from the View Controls can also be found in the Visualization Settings dialog. Expand the Visualization Settings dialog either by clicking the gear wheel icon in the bottom right of the Arrows tab or by opening the Visualization tab in the sidebar and unfolding the Data View → Arrows section.
 Direction
The Direction pull-down menu shows one choice for each loaded vector field. For a flow field for example, only the field Velocity is available. The Direction field is computed from the selected field.
|
Colors
The Colors pull-down menu applies these properties to the vectors resulting from the simulation. Colors are determined by the property value at the corresponding position. Colors can be assigned to all loaded components.
If Colors is turned off, a custom Color can be applied to all arrows by clicking on the color button.
|
Visible on Material IDs
Visible on Material IDs defines the material IDs in which the arrow field is shown. This allows to visualize the flow also in porous media where fluid flow is computed according to the Stokes-Brinkman equations (porous voxels / solid voxels / pores). Several material IDs can be selected at the same time.
|
Arrow Scale
The Arrow Scale scales the size of the arrows as a percentage of the maximum dimension (here, velocity).
|
Minimal Length
Minimal Length sets the minimum length used for the slowest arrow, before scaling. The values are limited to those between the maximum and the minimum in the Plot Range (here, between 0.00 and 0.012 m/s). This parameter is available in the View Controls and in the Visualization Settings dialog (under Visibility).
|
Count
Count X, Count Y, and Count Z define the number of arrows for each axis.
|
Clipping
Clipping works in the same way as seen for the structure.
|
Distance to Structure
In the Visualization Settings under Visibility find also the option to set a Distance To Structure. This defines a space around the solid structure model that is to remain void of arrows. If enabled, Distance To Structure Range 0 and Distance To Structure Range 1 give the range of distance where the vectors are shown (in voxels).
|
Normalize
Checking Normalize visualizes all arrows in the same size. This option is only available from the Visualization Settings dialog.
|
Mode
Mode changes the display of the arrows to appear as a Line or Thick. This option is only available from the Visualization Settings dialog.
|