Results
When the simulation of charging the electrode has finished, a GeoDict result file (.gdr) is available in the project folder and the Result Viewer of this result file automatically opens. Learn more about the general Result Viewer options in the Result Viewer chapter.
For the charging simulation of a single electrode, the same information as for charging a whole battery is available in this result file. It is shown, can be visualized, or further processed in the same way.
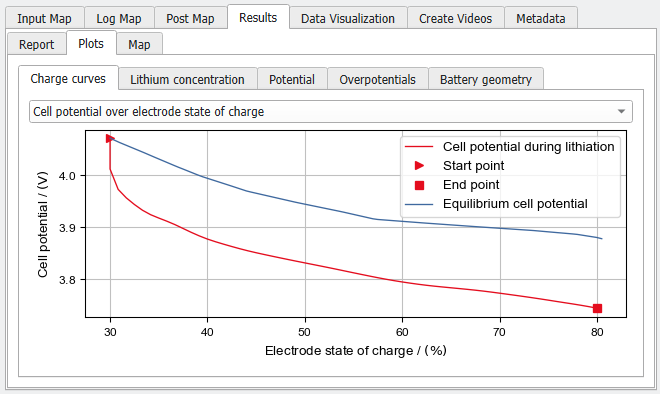
Note that for the charging simulation of a half cell, the modeled electrode is electrochemically always considered as the cathode. Lithiating the cathode, i.e., increasing the electrode state of charge, means discharging the half cell. On the Results -Plots – Charge curves subtab, the cell potential is shown over the electrode state of charge and is therefore decreasing during the charging simulation of the half cell.
It is important to note that in the volume files of simulation (*.cap files), the result fields are stored for the entire half cell structure (including the electrode, both current collectors, separator, and lithium reservoir), rather than just the electrode alone. If the structure used as input for the simulation (and shown in the Visualization area of the main GUI) does not contain all components of the half cell, the size of the volume fields therefore does not fit to the structure size. Therefore, when loading one of the volume fields, the complete cell structure containing also the missing half cell components is loaded automatically
Choose Load Cell.gdt on the Data Visualization tab to load only the structure of the whole half cell without additional volume fields.

Select a Time Step and click Load Cell_#.cap to load the complete cell structure and the desired volume fields of this time step to the visualization area.
