Results Tab
Report tab
Under the Results-Report sub-tab, the saturation-dependent Relative Thermal Conductivity table is shown for the chosen saturation rates (here, 0, 0.25, 0.50, 0.75, and 1), which are approximated as best as possible (here, 0, 0.256122, 0.519788, 0.742733, and 1).
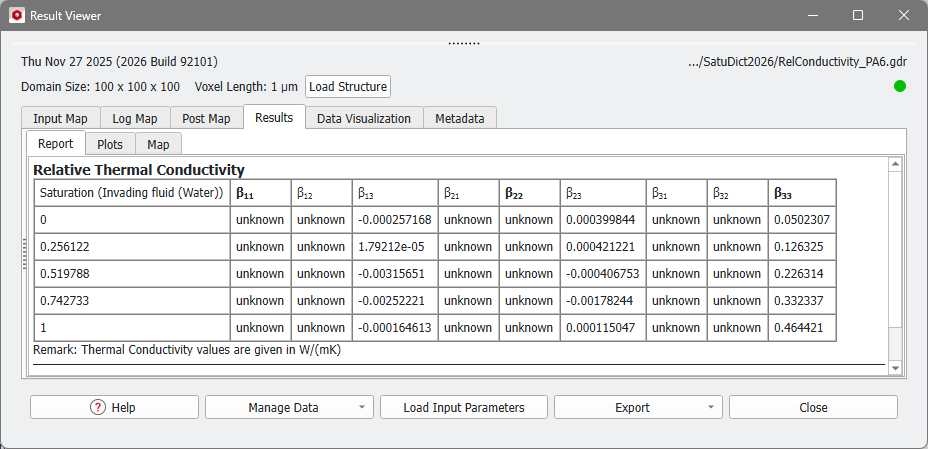
The saturation-dependent Relative Thermal Conductivity is shown in the tables, where each row stands for one saturation level. The values of the whole thermal conductivity tensor at each saturation step are given in the columns. For directions which were not selected as Computational Direction the conductivity value is unknown.
In the example above, the entries , , for the computation in Z-direction are given, the other values are unknown as the computations were not carried out.
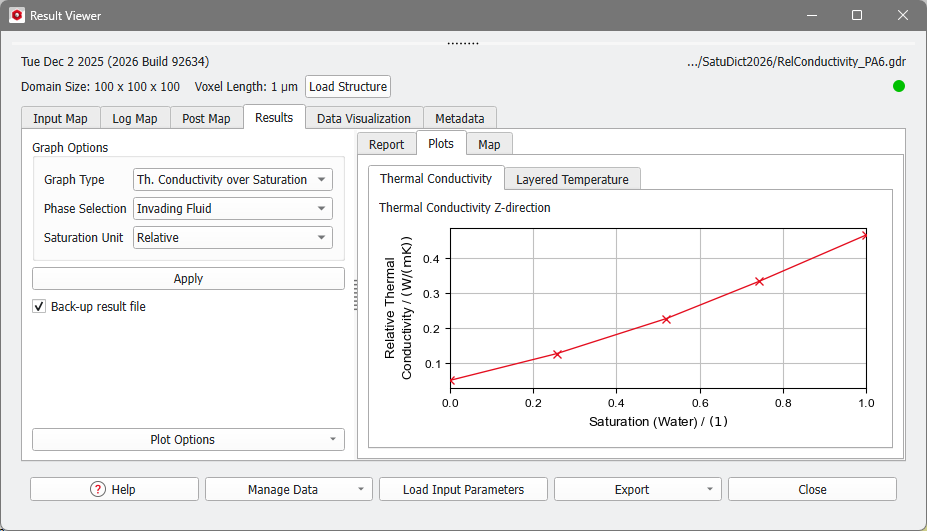
Plots tab
In the Results-Plots subtab, the values of the Relative Diffusivity table are shown in a graph. Also, the Layered Concentration in the computed directions is given.
Thermal Conductivity Plot
The values of the conductivity in all selected Computational Directions at the different saturation levels are shown in a graph.
On the left, the Post-Processing Widget allows you to fine-tune the Thermal Conductivity plot. Collapse the Post-Processing Widget by pulling it to the left.

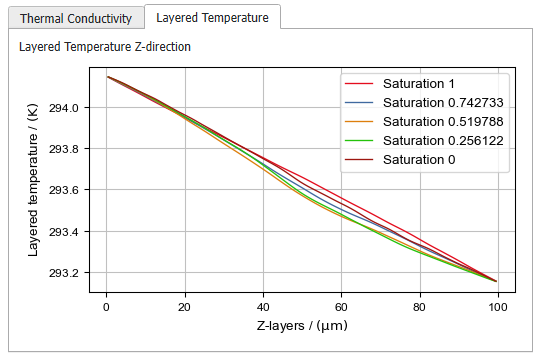
Layered Temperature
In the Layered Temperature tab for each computational direction the temperature in each layer is shown in a graph. The settings made under the Graph Options do not apply for these plots, but the axis settings and graph styles can be changed under Plot Options.