Create Videos Tab
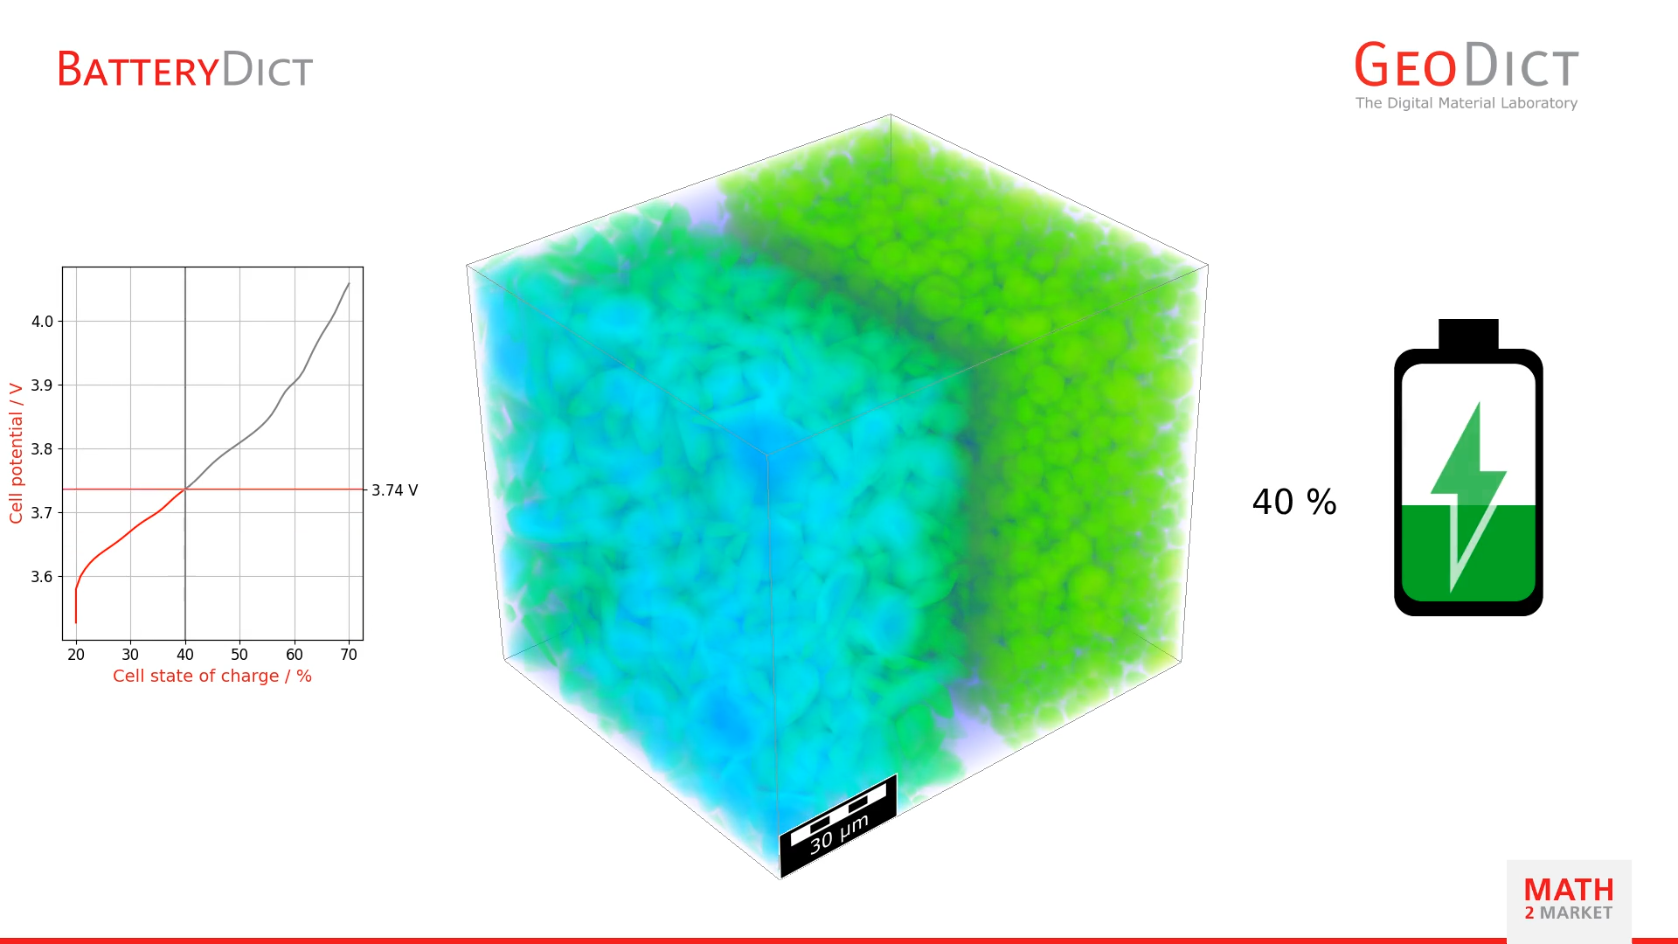
Through the Create Videos tab, a video showing the ion concentration while charging or discharging of the battery can be created. The first part of the video shows the cropping of the battery structure together with the ion concentration at the start of the simulation.

Click Create Video to generate the video with the default settings.
A screenshot of such a video is shown here. On the left side, you can see a graph displaying the cell potential over state of charge, with the current state of charge value indicated. In the middle, the ion concentration within the battery structure is illustrated. On the right side, a schematic representation of the current state of charge of the battery is provided.
Click Open Macro File, under the Create Videos tab, to open the GeoPy macro used to create the video, if you are interested in modifying it with a text editor. Find out how to edit macros and automate tasks in GeoDict in the GeoPy Scripting chapter.
Click Edit Parameters to modify the default settings of the video creation.
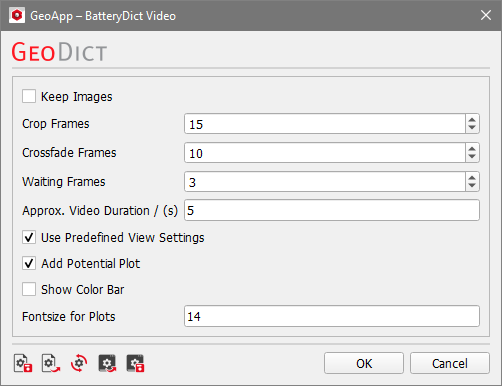
- Check Keep Images to save not only the video, but also the created images for the ion concentration in a separate folder.
- The number defined in Crop Frames defines the time for the cropping of the structure at the start of the video.
- Crossfade Frames defines the time for the visualization of the ion concentration field. The shorter the time defined here, the faster the charging is shown in the video.
- Waiting Frames: A higher number indicates a longer pause before and after charging.
- Check Use Predefined View Settings to use the predefined orientation of the structure for the video creation as shown in the example above. Uncheck this box to use the orientation of the structure as shown in the GeoDict Visualization Area.
- Check Add Potential Plot to keep the graph with the potential curve at the left of the video.
- Check Show Color Bar to add an additional color bar for the ion concentration below the structure.
- The font size for the potential curve graph can be set with Fontsize for Plots.
Click OK to confirm the changed settings and create the video.
A message is shown giving information about the video to save. Confirm by clicking OK.

If the video is created, the Play Video button is activated on the Create Videos tab.

