|
Navigation: GeoDict 2025 - User Guide > Simulation & Prediction > BatteryDict > Battery > Charge Battery > Results |
Scroll |
Data Visualization Tab
Solution files can be accessed via the Data Visualization tab. The number of available solution files depends on the length of the interval selected for output of intermediate results in Output Options.
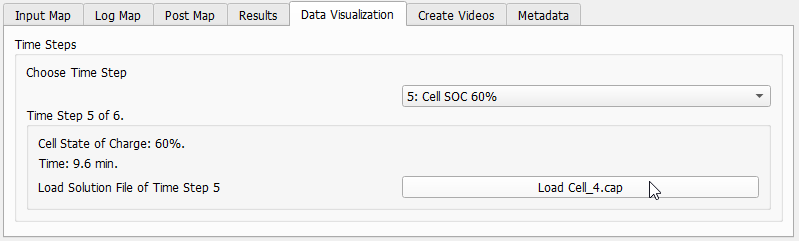

For instance, let us select the solution file at a state of charge of 70%. For the example shown here, we just need to select time step 5 (6: Cell SOC 70%). By clicking Load Cell_5.cap, the available volume fields (tab Select Volume Fields) of the file can be selected. Additionally, you may have a look at the file header of the result file (View File Header). Only the fields selected under the Output Options tab are available. Volume Fields available also depend on the solver used for the computation (LIR or BESTmicro). To reduce loading time, load only the desired fields. For example, you can only load the concentration in the solid part of the battery. In this case, first click Uncheck all. Then, select the field to visualize, in our example the ConcentrationSolid:ConcentrationSolid. After clicking OK, the selected field is loaded into the GeoDict main window. The concentration field of lithium ions for the active materials is visualized here. Various Visualization options are available for 3D result fields. The concentration gradient in the anode (left part of the battery) is in the example shown higher than in the cathode (right part of the battery). Check Allow clipping by distance to create a distance map regarding the solid material. Its value is zero on the surface of the solid material, inside the material the values are negative and outside positive. This allows clipping any result field by its distance to the surface of the solid material. Below, the concentration solid field is thresholded by distance. Here only concentration values for the active materials are shown, when they have exactly 0 distance to the active materials, meaning only the active material surfaces. Learn more about thresholding volume fields in Visualization. Check Keep existing Volume Fields if you repeat loading result fields for another time step or have other previously loaded volume fields in memory that you want to keep. If this box is not checked, previously loaded volume fields are discarded. If the simulation was run with LIR solver, volume fields are stored in a compressed way. Check Decompress fields, to be able to use all visualization features. Uncheck the box to visualize the adaptive grid structure used for the computation. In this case, not all visualization features can be used. Learn more about grid visualization in Visualization. |
Below find some result field examples: For the BESTmicro solver additionally the fields Kinetic Overpotential, Plating Potential, and Thermal Power Density are available, if checked under the Output Options tab. 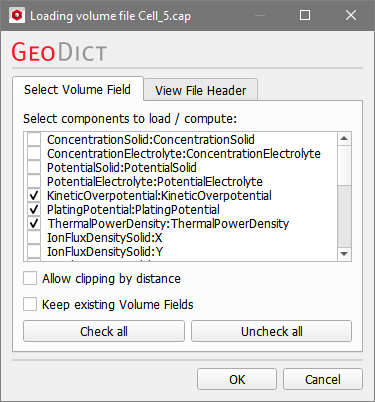 Below find examples for the fields thermal power density and plating potential. Lithium plating is a risk of battery degradation. It can occur especially at high charge rates or low operational temperatures and is indicated by values of the plating potential below 0 V. In the example above, all values are greater than 0. Thus, no plating should happen. We only visualized the anode, because plating usually does not take place in the cathode. The plating risk is experimentally determined by measuring the potential difference between the anode and a reference lithium electrode. In the simulation, the electrolyte potential (PotentialElectrolyte) is fixed in the center of the separator to 0 V. Therefore, the potential in the electrodes (PotentialSolid) can be interpreted as local potential difference with respect to a reference electrode. With the volume field PlatingPotential, even more detailed information on the plating risk is provided: The PlatingPotential describes the local plating condition, given by . Therefore, it provides a more exact estimation of the plating risk than PotentialSolid alone as it considers local variations of the electrolyte potential . The plating potential is calculated by This value is written into the surface voxels of the active material. If there are multiple electrolyte voxels in the immediate vicinity, they are averaged arithmetically. |
©2025 created by Math2Market GmbH / Imprint / Privacy Policy
