|
Navigation: GeoDict 2025 - User Guide > Post-process results > Create Videos > Video Editor |
Scroll |
Graph Field
In the Graph field, keyframes and data points can be modified, created, deleted, and captured.
Zoom in and zoom out can also be applied using the mouse wheel while the cursor is inside the plot of the Graph field. The zoom takes the cursor as its center and zooms in and out of its position in the plot of the Graph field.
Hold the right mouse button and move the cursor inside the plot of the Graph field to move around the view.
If only one axis should be affected, hover the mouse over the value range of the axis and use the mouse wheel to zoom, or the right click to move, just on this axis.

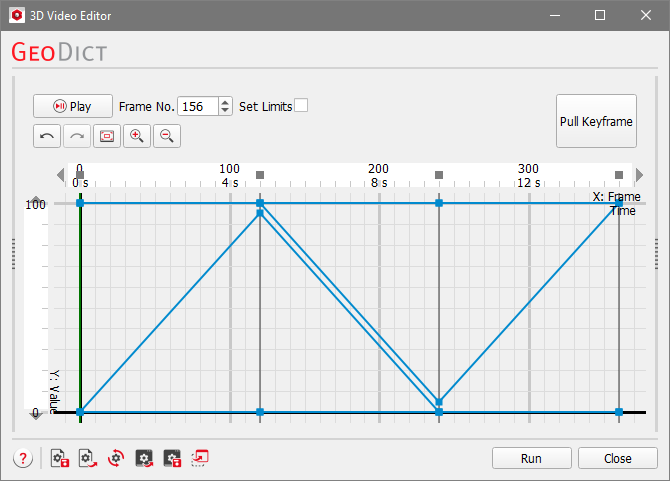
At the top of the Graph field, by clicking the Play button, the animation defined in the Graph field from the first keyframe to the last keyframe is played in the GeoDict Visualization area.  The frame of the animation is displayed in the plot of the Graph field by a vertical green line, the playhead, that moves along the X-axis. It can be set manually by left clicking on the X-axis in the Graph field, or by entering the desired frame number for Frame No. above the plot. This also updates the GeoDict’s Visualization area. Click Stop to end the playing back. If only a small part of the animation should be played in a loop, check Set Limits and enter the desired limits or move the starting arrow ( 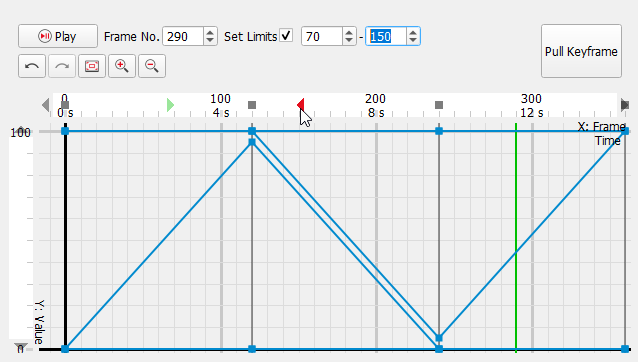 |
 ) and the end arrow (
 ) on the X-axis to the desired positions. In the example below, clicking Play will only play the frames 70-150 back. This option does not affect the final video rendering when clicking on Run.
Below the play options, several buttons control the view of the graph as described here:
|


The button Pull Keyframe is found in the upper right corner of the Graph field. 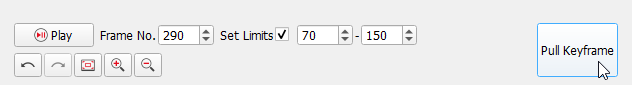 Pull Keyframe reads the current state of the Visualization area in the GeoDict GUI and transfers it into the Graph field. If a property has changed but is not recorded in the Properties field, GeoDict gives you the possibility to add it. The new keyframe is then inserted at the playhead’s position. An example of pulling a keyframe from GeoDict is given here. 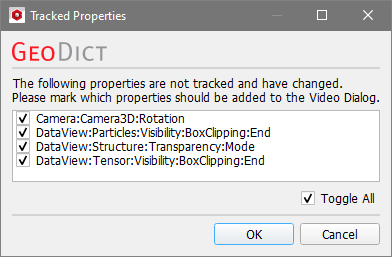 If no property was changed, still a new keyframe is added at the playhead’s position, containing interpolated data points for all properties in this plot section. |
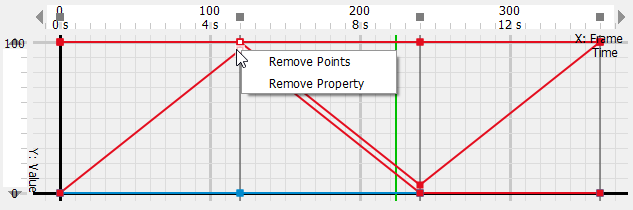
On the X-axis, which represents the time in frames, (in this example) markers can be found at frames 0, 120, 240 and 360. Those markers are keyframes and are shown as a small dark gray box on the X-axis and a dark gray line in the plot of the Graph field. If the Video Editor was opened by clicking Open Empty, there are no keyframes to be found. Keyframes are groups that contain the data points, represented by small blue or red boxes on the keyframe lines. A keyframe can be selected by left clicking on the small dark gray box on the X-axis. If the keyframe is selected, this box is marked white. Also, all data points to be found on the selected keyframe are selected automatically. By left clicking and holding, the user can change the position of the keyframe in time. Move the cursor left or right to decrease or increase the number of keyframes used for the last keyframe field. Moving the last keyframe also changes the total number of frames used for the animation. 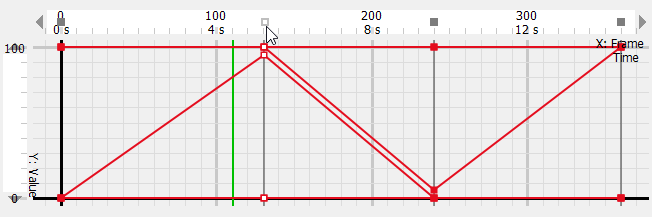 To remove a keyframe, right-click the keyframe marker on the X-axis to call its options menu and select Remove Group to delete it.
|

The X-axis represents the time in frames. A standard animation runs at a speed of 25 FPS (frames-per-second). Due to this, for example, for an animation that lasts 4 seconds, the properties need to be set over 100 frames. However, the Frames per Second can be changed on the right in the Output Options panel. Observe how the time values change in the X-axis of the plot in the Graph field for different FPS values. |
To select a data point of a property on a keyframe, left click on the blue or red box which represents the data point. The selection status of the data point is indicated by displaying a smaller white box inside its box. Also, the data point shows up in the Value field with its name, frame, value, and interpolation type. Multiple data points can be selected by drawing a multiselect rectangle. To do so, click and hold the left mouse button in the Graph field and draw a box around the desired data points. All data points within the box are then selected. Change frame and interpolation in the Value field. Considering only one data point, the value and frame can be alternatively changed by selecting it and holding down the left mouse button. Then, move the cursor up and down along the keyframe to raise or lower the value or move the mouse left and right to change the timing or frame of a data point. This automatically creates a new keyframe if there is none at the chosen time or attaches it to an existing keyframe. Right clicking on a data point offers the following options:
 |
The following options are available by right clicking in the plot of the Graph field:
|
©2025 created by Math2Market GmbH / Imprint / Privacy Policy