Properties Field
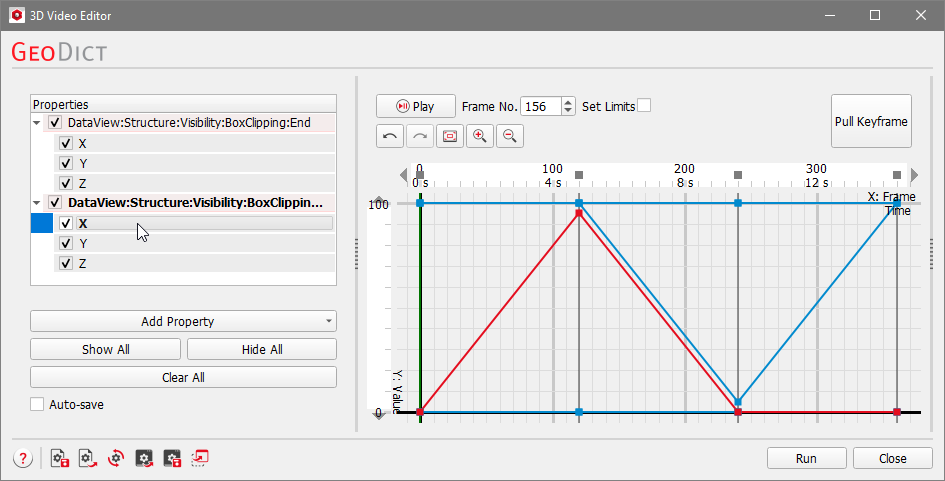
In the Properties field, two properties (considering the Clipping X video preset) are already displayed by default. If the Video Editor dialog was opened by clicking Open Empty in the Create Video dialog, the Properties field is empty, and no plot is displayed in the Graph field.
 Property Names
The long names of the Properties are also the path of the properties in the Visualization Settings panel in the GeoDict GUI and in the GeoPy script structure.
If Unroll as Python was checked in the Export Video dialog, the corresponding keys of the property are found in the resulting Python macro. Learn more about the visualization settings in the Visualization user guide and how to edit and play back Python macros in the GeoPy scripting user guide.
|
Show Properties in Graph Field
If the box on the left side of the Properties’ name is checked, the corresponding curve is visible in the Graph field.
In the example, the BoxClipping:Start property defines the clipping in the corresponding directions (X, Y, Z) and the BoxClipping:End defines the clipping from the other sides, respectively.
Click the arrow on the left or double click on the property to unfold the sub-properties, if they are available. In this example, the different clipping axes are the sub-properties of BoxClipping.
The sub-properties, boxes are also available for checking to show or hide the sub-property in the Graph field.
Clicking on a property in the Properties field highlights the selected property in the Graph field in red, to visualize its change of values over time.
|
Right-Click Dialog
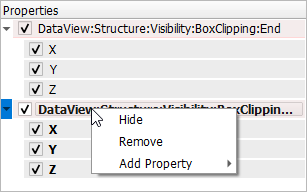
Right-clicking on a property opens a dialog providing the following options:
- Hide (or Show): Unchecks (checks) the property and thus, hides (shows) the corresponding graph in the Graph field.
- Remove: Removes the property from the Properties field, and thus also from the Graph field.
- Add Property: Adds a new property to be changed over time. More information about this option is given below.
|
Add Property
For Add Property, most of the visualization settings of GeoDict can be selected. They are organized corresponding to the Visualization Settings panel, that can be expanded and collapsed, on the right side of the Visualization area of the GeoDict GUI, accessible by clicking on the tab at the right. Learn more about these settings in the Visualization handbook.

|
Know how!
If working in the 2D Video Editor, only Properties available for Mode - 2D can be added to the Video Editor. The other settings are grayed out.
When using the 3D Video Editor, only properties available for Mode - 3D can be selected.
Properties available for both visualizations can be chosen for both editors.
The selected property is added to the Properties field and can be modified in the Graph field. An example for adding and editing a property is given here.
|
|
Show All, Hide All, Clear All
Show All checks all properties in the Properties field to be shown in the Graph field.
Hide All unchecks all properties in the Properties field, resulting in an empty Graph field.
Clear All clears and deletes all properties along with all keyframes and data points.
|
Auto-Save
Auto-save: Check to save the current settings as start-up settings with each change. Thus, the video settings are not lost after closing GeoDict and can be loaded again by opening the Video Editor with the option Open Current in the next GeoDict session or by clicking the Load Start-up Settings icon in the bottom left of the Video Editor.
|