Results
The result file (*.gdr) is opened in the Result Viewer after the computation is finished.
The left panel of the Results tab, can be collapsed (and expanded) by pulling left (or right) the dotted line between the post-processing options and the Results – Report subtab.
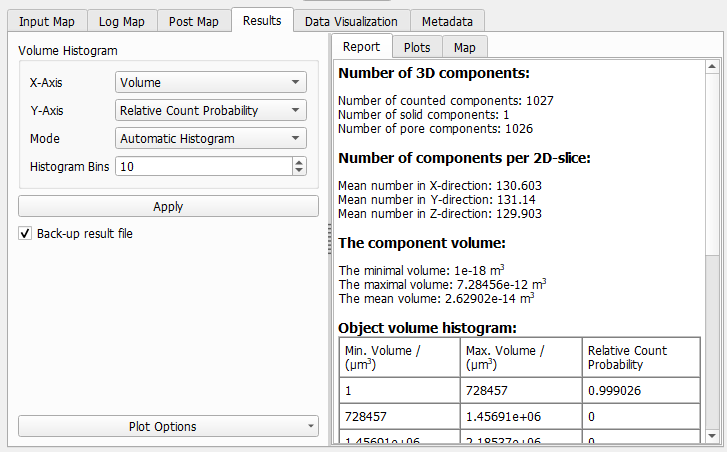
Under the Results - Report subtab, the information about the Number of 3D components, Number of components per 2D-slice, The component volume and the Object volume histogram is given. The object volume histogram is also shown graphically under the Results - Plots subtab. In the plot, the values for each bin are visualized as bars. As a post-processing step, the settings of the object volume histogram are adjusted and changed on the left-hand side panel.
|
Know how! The options are the same as the ones available under the Post-Processing tab in the Connected Components dialog. |

The X-Axis pull-down menu allows choosing whether the components should be classified based on volume (Volume) or based on volume equivalent sphere diameter (Equivalent Diameter).

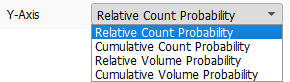
For the Y-Axis pull-down menu, the Relative Count Probability provides the number of components in each bin normalized to the total number of components. The Cumulative Count Probability is the sum of the Relative Count Probability over all bins starting from the bin with the smallest value. Relative Volume Probability gives the volume of the components within one bin normalized to the total volume of all components. The Cumulative Volume Probability sums up the Relative Volume Probability of each bin of the histogram starting from the smallest one.
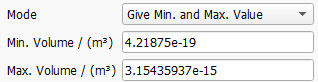
The histogram Mode offers the choice between generating an Automatic Histogram without further specifications or to Give Min. and Max Value for the parameter defined in the X-Axis pull-down menu (Volume or Equivalent Diameter).

In the latter case, either Min. Volume and Max. Volume or Min. Diameter and Max. Diameter (depending on the choice for X-Axis) can be directly entered here.
The number of Histogram Bins determines the number of rows in the Object Volume Histogram table and the number of bars in the plot.

The table and plot are updated when the Apply… button is clicked after changing the Volume Histogram input parameters.
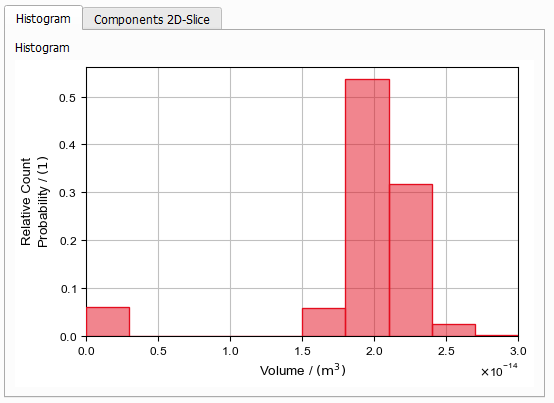
Under the Plots tab, also the computed Number of Components per 2D Slice is visualized by three graphs, one for each direction, which are selectable in the drop-down menu.
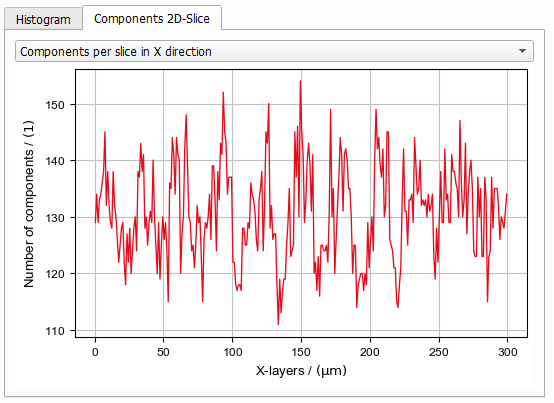
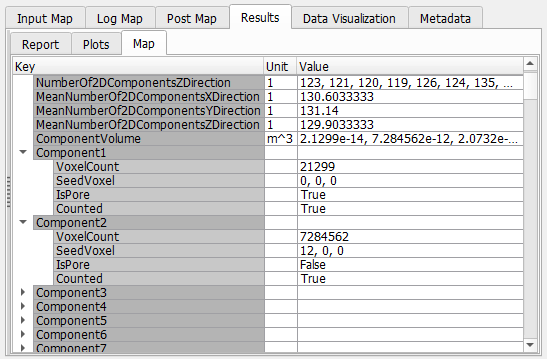
The Results-Map subtab additionally contains an overview of the computed parameters, such as component volume, number of 2D components in each direction and mean values of each. Moreover, the details for every found component are given:
- VoxelCount states the number of voxels inside of a component.
- SeedVoxel is an arbitrary voxel inside of this component.
- IsPore states if this component is pore or solid.
- Counted states if this component is counted.