Results
The result file (*.gdr) is opened in the Result Viewer after the computation is finished.
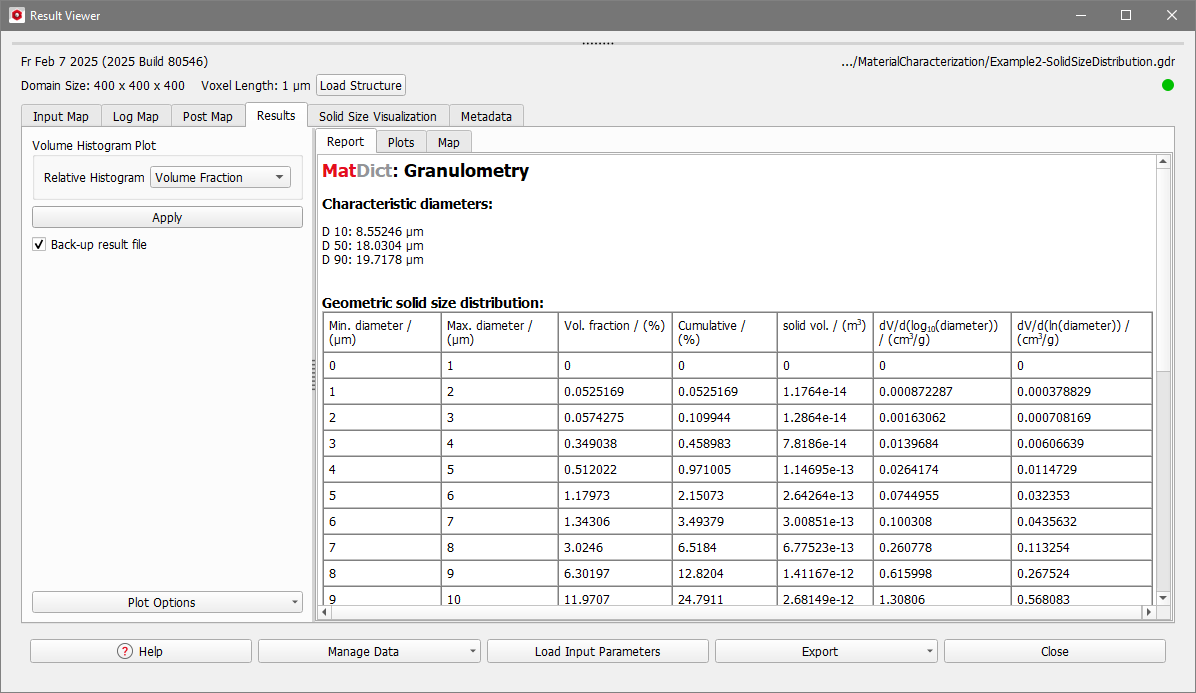
Under the Results - Report subtab, the Characteristic Diameters are shown. Here, the D10 value of 8.55 µm means that 10% of all solids have a smaller diameter than 8.55 µm. The D50 value of 18.03 µm means that 50% of all solids have a diameter smaller than 18.03 µm, and the D90 value of 19.71 µm means that 90% of all solids have a diameter smaller than 19.71 µm. The discretization error is less than 1 voxel, which means for the presented example, that the D10 is 8.55 µm ± 1.0 µm.
Below the characteristic diameters, a table contains Minimum and Maximum Diameters, Volume Fraction, Cumulative Volume Fraction, the Solid Volume, and the Differential Solid Volume Distribution for every bin. Also, at the bottom of the Report tab, the total solid volume percentage of the structure is shown.
The Volume Fraction of the solid voxels in each bin and the Cumulative Volume Fraction (starting with the smallest solid diameters) based on the total solid volume of the structure are shown. For each bin, the Solid Volume in m3 is computed as the summarized volume of the voxels that belong to this bin.
The Differential Solid Volume for each bin is computed, where both the common logarithm () and the natural logarithm () are shown. The differential solid volume distribution is then computed as:
with the solid diameter of the -th bin, the cumulative volume fractions, and the mass of the solids. The latter is computed using the densities of the constituent materials of the sample entered in the Material Densities tab. This normalization ensures that the value of the differential solid volume is independent of the domain size.
Under the Results – Plots subtab, different relative and cumulative histograms can be plotted. The histogram of interest, i.e. Volume, Volume Fraction, or dV/d(log(Diameter)) can be chosen in the Volume Histogram Plot section.
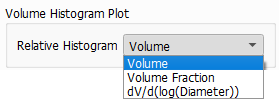
After choosing and clicking Apply…, the plots change accordingly.
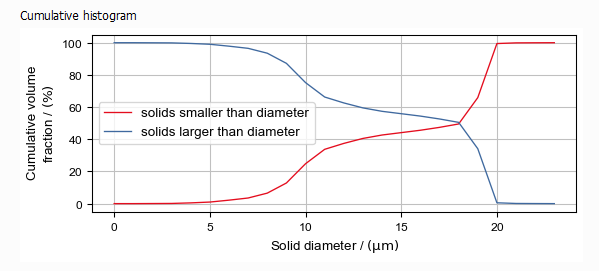
In the Cumulative Histogram plot, the red curve shows the volume fraction of solids smaller than a given diameter and the blue curve shows the solids larger than or equal to a given diameter. Both curves sum up to 100% for any given diameter.
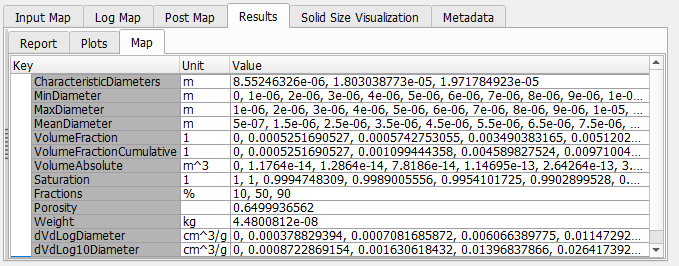
Finally, the Results - Map subtab gives access to the values of the computed parameters.