Results
The Result Viewer opens at the end of the calculation.
In the Results – Report tab a table shows for each distance the computed autocorrelation of two points having this distance. Below the table, the computed direction is shown. At the bottom, the Correlation Length in voxels is given. It is computed as the standard deviation of the fitted gaussian.
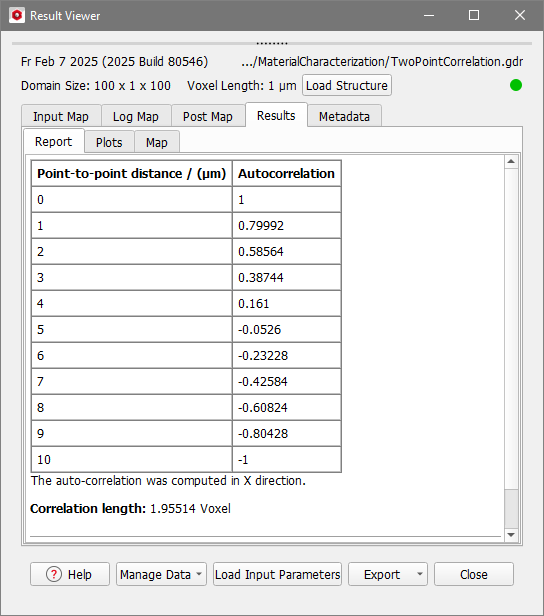
In the Report – Plots subtab the values from the table are graphically shown.
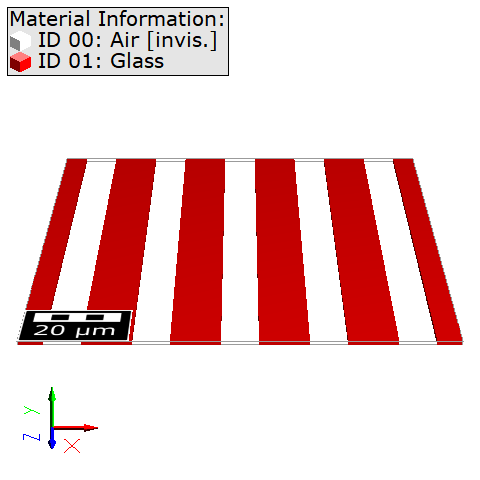
In the example below, a structure with bars of width 10µm each and space of 10µm between them is shown. The voxel length is 1µm and the structure has a size of 100x1x100 voxel. The 2-point correlation is computed in X Direction and with a maximal distance of 100 Voxel. Compare the results with and without Periodic checked.