Automatically generated Plots
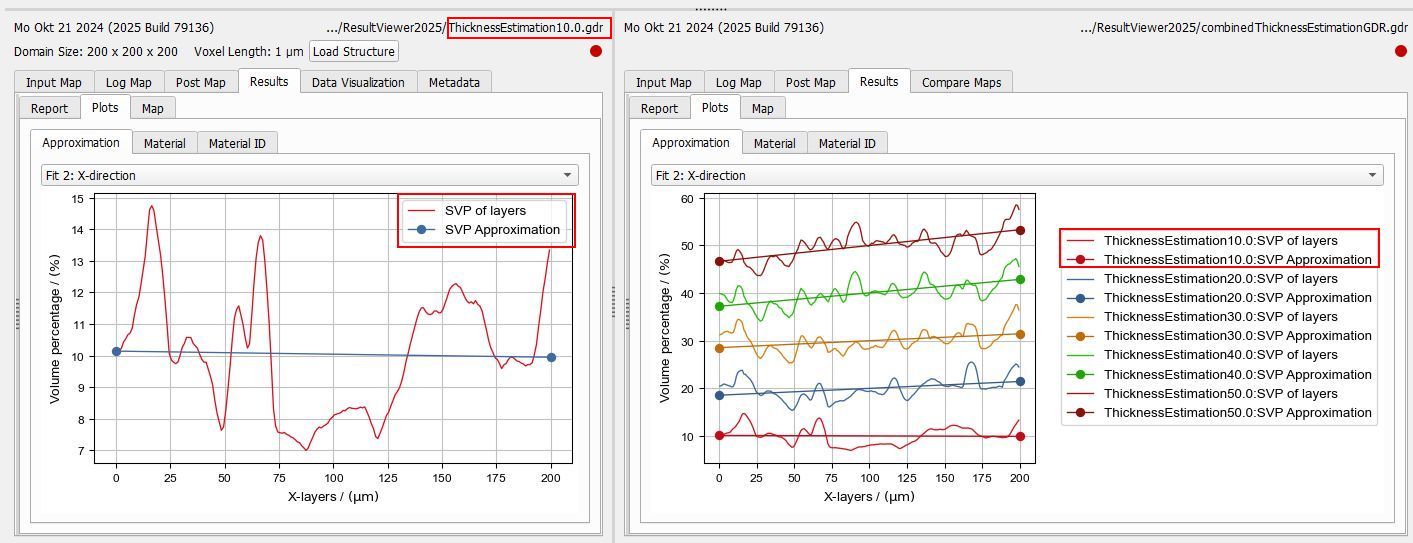
When creating combined result files, the plots of the individual result files are also included in the Plots tab of the combined result. If a plot is contained in more than one of the original result files, the data is merged into one plot. Depending on the Combine Mode chosen during creation of the combined result file, the graphs of the merged plot have different colors or different markers.
The graph names shown in the legend fit to the result file names from which they originate. They are of the form name:suffix, where name is the origin result file name. If it is not located in the current project folder, the relative path to it is shown. The suffix is the graph title in the original result file.
In the example below, one of the original result file names was ThicknessEstimation10.0 and one of the graphs had the name SVP of layers. Thus, the new graph name in the combined result file is ThicknessEstimation10.0:SVP of layers.
Rename graphs of automatically generated plots
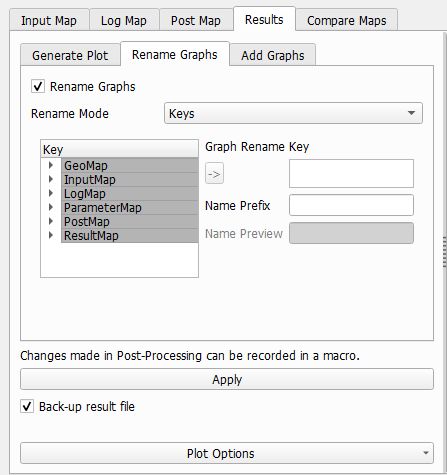
Under the Rename Graphs subtab of the post processing panel, the labels of automatically created combined plots can be changed. Check the Rename Graphs box and select a Rename Mode for the graph name. The suffix will not be changed in any rename mode. Clicking the Apply… button renames all automatically generated plots on the result file according to the set renaming rules. Custom generated plots are not renamed in any way.
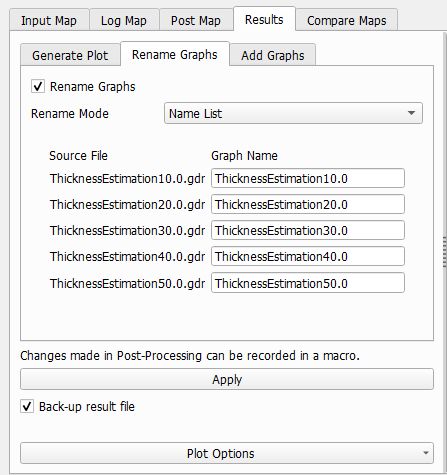
Name List
Choose Name List to define the name of the graphs for each original result file separately
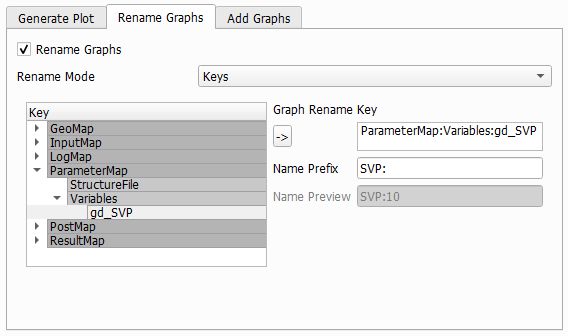
Keys
With the rename mode Keys the graph name is generated using a key from the maps occurring in all underlying result files. Select a key from the left and click on the  icon to select it. The value of the key will then be taken as new name. You can additionally add a Name Prefix to the selected key value if it is necessary. The field Name Preview shows the final name according to the settings you made.
Example
As an example the graph names of the combined result file shown at the top are changed using the rename mode Key. The new name will be the value of the key gd_SVP with the name prefix SVP: