Arrows
Some volume fields as for example a flow field can be represented by an arrow field. Here, the properties of the fluid flow field are imaged at all positions of a regular grid that do not belong to the solid. At each of these positions, the local orientation of the flow field is indicated by a vector and its length and color are coded for the fluid velocity.
Small vectors indicate a slow fluid velocity and long vectors indicate a high fluid velocity. Vectors are located with their middle in the center of the voxel for which they represent the flow velocity.
To see the arrows, check only View →  Arrows in the menu bar, the Arrows tab in the View Controls, or Data View u Arrows in the Visualization Settings dialog.
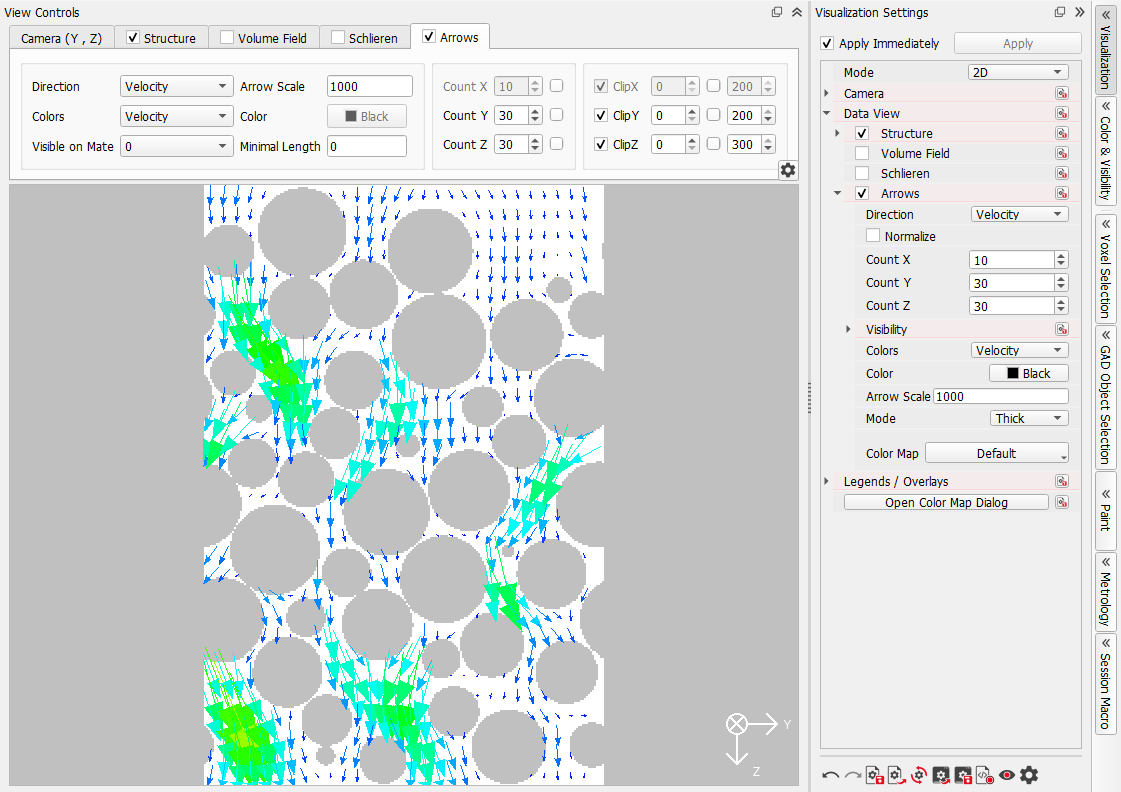
The options are the same as for the 3D visualization.
