Result fields contain property data from simulations. Many of the analysis and all of the simulation and prediction modules write 3D result fields. For the 2D view, three different kinds of result fields can be visualized: Volume Field, Schlieren and Arrows.
There are two ways to open a result field. The first, and most common, way is loading them from the Result Viewer, as described in the following. Another way is via File - Load Volume File.
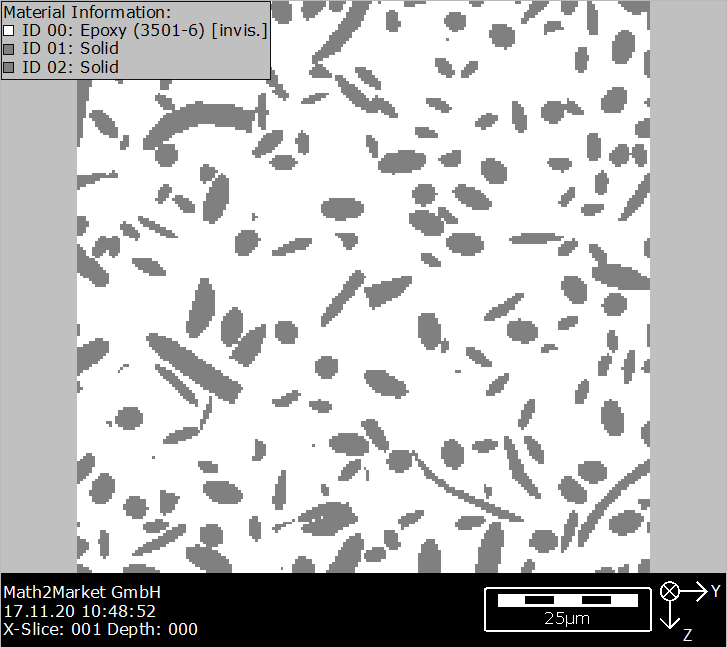
Open a result file (*.gdr) by clicking the  icon in the toolbar and navigating to the location where a file, for example, obtained with ConductoDict is saved. Here, the file name is EJHeatResult.gdr and the example structure is a fiber structure as shown below. icon in the toolbar and navigating to the location where a file, for example, obtained with ConductoDict is saved. Here, the file name is EJHeatResult.gdr and the example structure is a fiber structure as shown below.
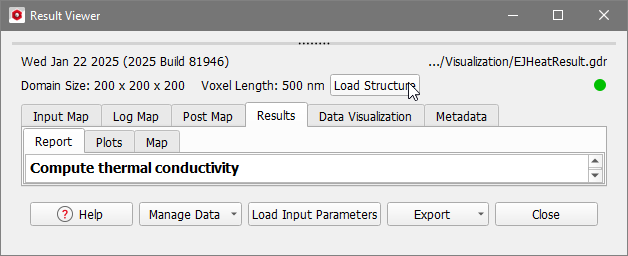
The Result Viewer of the .gdr result file opens at the Results – Report tab.
Unless the structure is already in memory and showing in the Visualization area, click Load Structure to display it.
Observe the structure in 2D view in the Visualization area by selecting View → 2D Cross Section (SEM).
In the Result Viewer, click the Data Visualization tab.
Check the result field to load, here VolumeField_z.hht, and click Load to access the computed results: in this case the results of temperature flux saved in the *.hht file. When loading a result field, additionally the corresponding structure is automatically loaded, if not already in memory.
The directions that were not selected are not computed, and, thus, are unavailable.
Then, choose the components whose results can be visualized. For visualizing streamlines, schlieren or arrows, a complete vector field needs to be loaded. This means all components of one image, for example all HeatFlux components or all Velocity components.
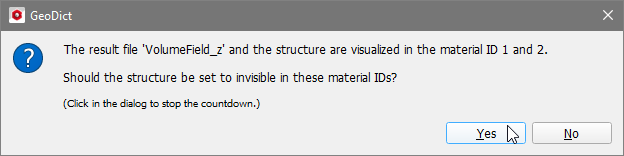
If the results are computed for the solid materials, as is the case in this example, you are offered the choice to set the materials in the structure invisible. This is done to better observe the result field without the microstructure overlapping it. It is recommended to click Yes.
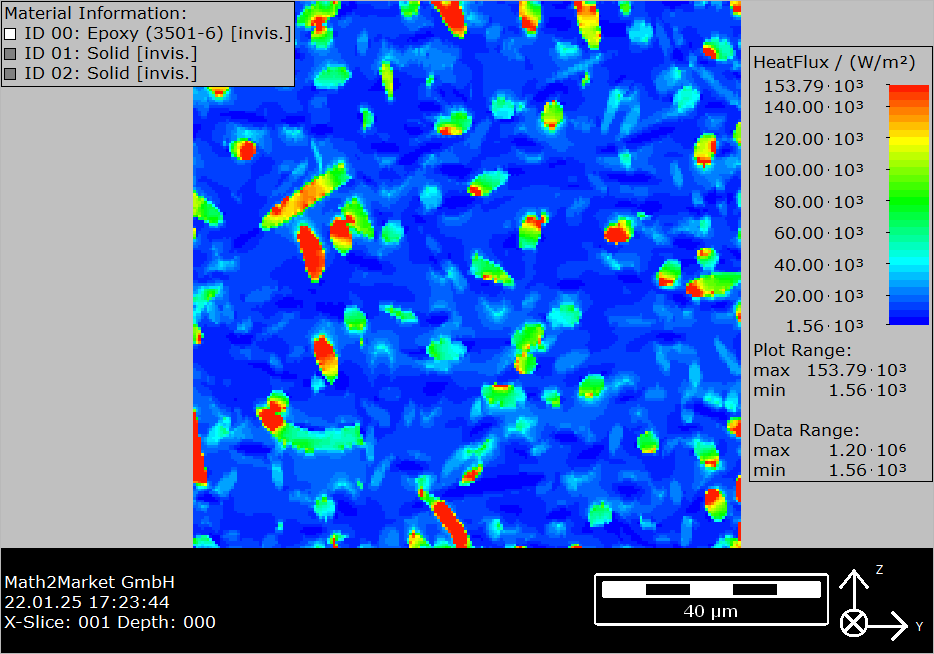
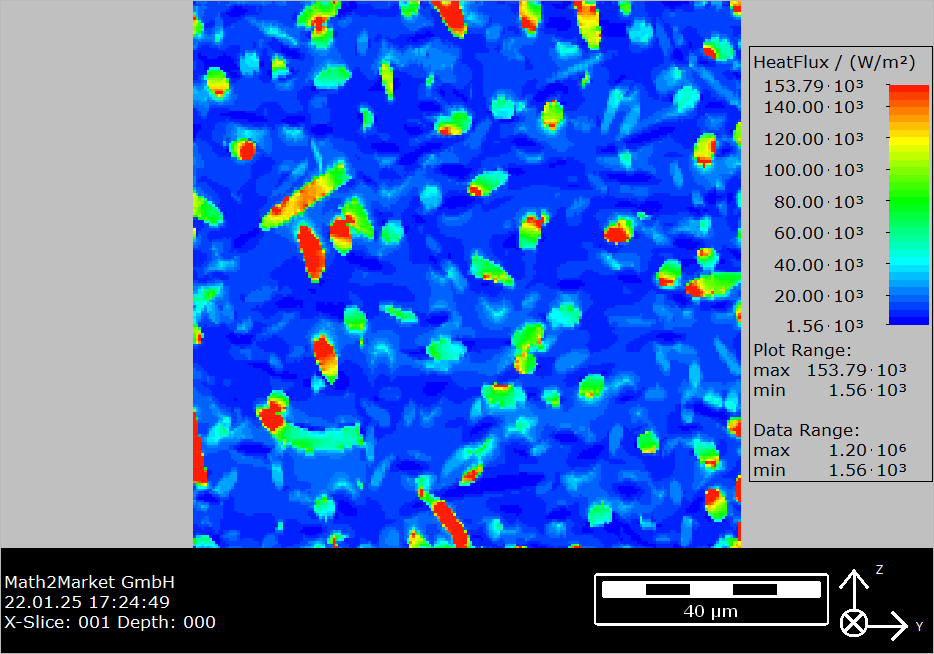
Now, the display in the Visualization area changes and you can observe the information computed for the gradation of temperature. The values are indicated on the color bar of the Volume Field Legend that appears to the right (default position).
It may be useful to switch off the display of the Material Legend (View → Legends / Overlays → Material Legend in the menu bar or in the GUI Sidebar).
|
 in the toolbar. Five tabs are present to control the 2D Cross Section View settings: Camera, Structure, Volume Field, Schlieren and Arrows.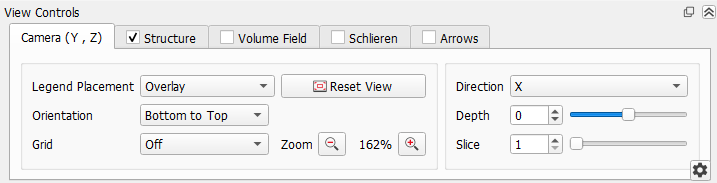
 Load structures and result fields to GeoDict