Camera
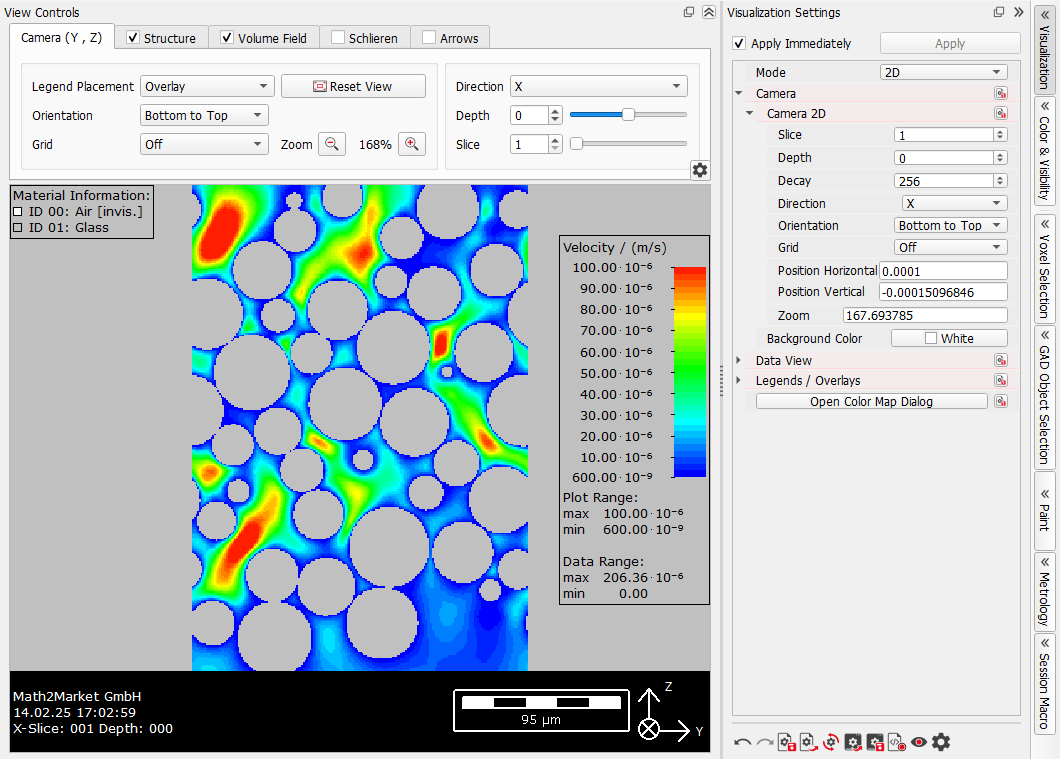
Under the Camera tab of the View Controls, you can choose which part of the structure is shown in the Visualization area. Here, with the initial default of Direction X, the tab is Camera (Y, Z).
Some additional options and most of the options from the View Controls are also found in the Visualization Settings dialog. Expand the Visualization Settings dialog either by clicking the gear wheel icon in the bottom right of the Camera tab or by clicking the Visualization tab in the sidebar and unfolding the Camera → Camera 2D section.
 Legend Placement
Two visualization options are available for the Legend Placement. If Overlay is selected, the legends are displayed above the 2D image, while for Attached the legends are placed around the image.
|
Orientation
Change the image’s Orientation by switching between Bottom to Top and Top to Bottom.
|
Grid
By default, the Grid is set Off. Enable the grid by selecting one of the other three options: Regular Grid, Adaptive Grid and Structure Outlines.
If a compressed flow field computed with the LIR solver is loaded, the Adaptive Grid is visualized when the user unchecks Decompress fields while loading the volume field. (A compressed field is saved when checking Write Compressed Volume Fields under the Solver tab of the LIR Solver Options dialog).
Unchecking Decompress fields to observe the Adaptive Grid has the effect of disabling some visualization features.
Then, select Adaptive Grid, as the Grid to be shown, under the Camera tab in the View Controls. Observe the small grid cells displayed near the pore-solid interface and the large grid cells in the center of big pores. Select Structure Outlines to display the outlines of the structure.
If GAD-objects are loaded, Structure Outlines are computed considering the GAD-objects. Thus, the outlines of each GAD-object are shown. In the example below, the Grid is set to Structure Outlines. On the left, the GAD-Objects are loaded with the foam structure and on the right the GAD-objects were discarded, leaving only the voxel structure in the visualization area.
|
Zoom and Reset View
Use the buttons to zoom in and out of your loaded structure / result field. Instead you can also use the mouse as described here. In the Visualization Settings dialog, control the Zoom by entering values directly.
Click Reset View to reset zoom and panning.
|
Direction, Depth and Slice
Direction X, Y, or Z, selectable though the pull/down menu, are the directions to which the cutting plane is perpendicular.
For example, choosing X-Direction slices the structure along the X-axis and shows images in the YZ-plane. The Slice slider controls the display of the cross-section in the selected cutting plane. The slice can be changed by moving the slider, by entering the slice number, or through the up and down arrows.
The Depth slider controls the slice view profundity when visualizing in 2D cross section mode. This allows to visualize images very similar to those produced by Scanning Electron Microscopy (SEM).
The maximal Depth value is given (and can be changed) by the Decay value (Visualization tab of the sidebar: Camera → Camera 2D → Decay)
The results of changing the depth are most noticeable in black and white view (Color & Visibility tab from the sidebar → Load Preset button → Black and white).
|
Position Horizontal and Vertical
When panning the structure in the visualization area with the left mouse key, the values for Position Horizontal and Position Vertical change accordingly. The structure can only be panned, if zoomed in.
Click Reset View to reset zoom and panning.
|
Background Color
Change the Background Color for the structure by clicking on the color button.
|