|
Navigation: GeoDict 2025 - User Guide > Post-process results > Visualization > Visualization Options > Visualization 3D |
Scroll |
Streamlines
Visualize the flow through your structure with streamlines or even animated streamlets.
The Streamlines tab controls the visibility of the streamlines or streamlets. Some additional options and all the options from the View Controls can also be found in the Visualization Settings dialog. Expand the Visualization Settings dialog either by clicking the gear wheel icon in the bottom right of the Streamlines tab or by opening the Visualization tab in the sidebar and unfolding the Data View → Streamlines section.

The Flow pull-down menu shows one choice for each loaded vector field. For a flow field for example, only the field Velocity is available. The color coding of the streamlines is based on the chosen field. |
Checking Periodic enables periodic boundaries for the display of the streamlines, i.e. the streamlines exiting the tangential domain boundaries are reentering the domain periodically. |
The choices for Placement define from where the streamlines, streamlets, or streamtubes are calculated. Select the streamline starting positions from the pull-down menu for Placement (or Placement u Type). Choosing any of them gives options for their display, as seen above for the Inflow-Plane Placement. Either the starting points (or seeds) for the calculation are placed
Selecting Inflow-Plane distributes the starting positions on the flow field inflow plane. In flow fields, this plane is determined by the flow direction. If for example, the flow is computed in Z-direction, the inflow plane is the XY-plane. Then, Count 1 and Count 2 define a grid in the inflow plane. Increasing the number, increases the number of streamlines in the respective direction. Selecting 3D-Box for Placement Type defines a three-dimensional box with corners (Start 0, Start 1, Start 2) and (End 0, End 1, End 2). Inside this box Count X x Count Y x Count Z streamlines are placed regularly.
To distribute the starting positions randomly, select Random. For Random Placement choose a value for Count, controlling the number of starting positions for the streamlines. Choosing Material ID places seeding positions only inside voxels of the selected material ID. Max Count defines the number of starting positions for streamlines. The seeding points are all placed at voxel center positions. If there are less voxels of the material ID present, than given for Max Count, less streamlines are visualized. Select Circular to place the streamline starting positions on circles around the defined Midpoint. The Direction then defines an axis through the Midpoint on which the circles are placed. Define the Radius for all these circles. The number of circles is controlled with the value entered for Repeat. The distance between the streamline starting positions on the circles is defined by Density. The placement type Line places the starting positions on a line from (Start 0, Start 1, Start 2) to (End 0, End 1, End 2). The value for Count controls the number of streamline starting positions.
Select the placement type Point to place a single streamline at the starting position defined by Position 0, Position 1, and Position 2. |

The choices in Line Style are Streamline, Streamlet, and Streamtube. If Streamlet is selected, the Play button becomes available. How to animate streamlets is explained here. |
The thickness for each line style is controlled through Line Thickness, here shown for streamtubes. |
Choosing Streamlet activates the visualization of the streamlines as streamlets, a visualization in which a streamline is fragmented into segments. The movement of these segments along the streamline is visualized and can be animated by clicking Play. The animation is repeated in an infinite loop until Play is clicked again. 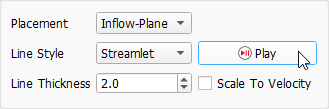 The visualization and animation of streamlets is controlled by four options in the Visualization Settings dialog in the Streamlet section: 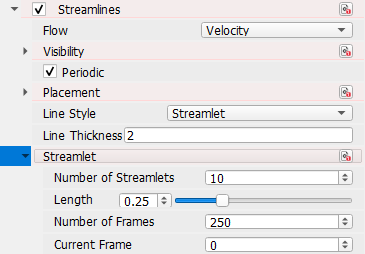
When Streamlets is chosen, Scale to Velocity additionally adjusts the movement of the streamlets in relation to the maximum velocity of the flow field. As a result, the streamlets move with individual velocities and not with a uniform speed, as they would do without a scaled velocity. Generate a video using the Create Video dialog (File - Save Video as). Select the Streamlets preset. You can either just click Generate Video or change some video settings by clicking Open Video Editor. How to create videos in GeoDict is explained in detail in the Create Videos handbook. 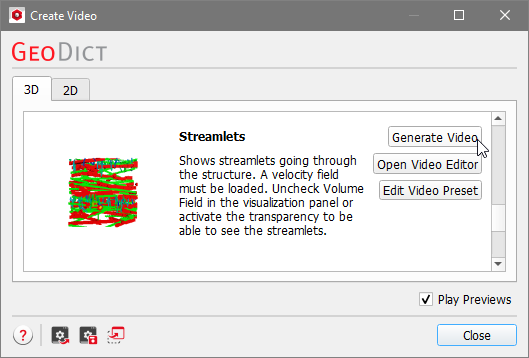 |
 Scale to Velocity and Minimal Velocity
The setting Scale to Velocity affects the visualization of streamlines and streamlets and is coupled with Minimal Velocity. This is a clipping tool based on the velocity of the fluid. In this case, streamlines and streamlets with a velocity lower than the specified Minimal Velocity are not shown in the visualization. In the Visualization Settings dialog the option is found under Data View u Streamlines u Visibility. When Streamlets is chosen, Scale to Velocity additionally scales the streamlet lengths to their velocity, i.e. for higher velocities, the streamlets are longer. Also, it adjusts the movement of the streamlets in relation to the maximum velocity of the flow field, when animating the streamlets. Below observe the effect of scaling to velocity and entering a minimal velocity. |
The streamlines, streamlets, and streamtubes cannot only be clipped according to their velocity but also conforming to their spatial position, in a similar way as explained for the structure clipping. It is possible to define the range of voxels in each spatial direction that are to be displayed by moving the slider or by direct input of the value. 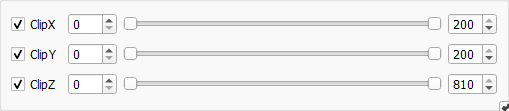 |
©2025 created by Math2Market GmbH / Imprint / Privacy Policy
