Data Visualization
If Save Trajectory File was checked, it is possible to load and visualize the particle trajectories under the Data Visualization tab. By clicking Load Particles, the GPT file (GPT, GeoDict particle trajectories) is loaded.
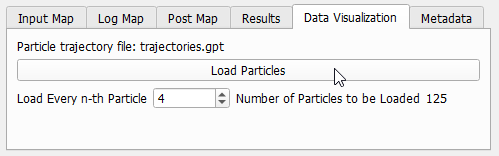
As the number of simulated random walks may be very high, it is possible to load only Every n-th Particle. The Number of Particles to be Loaded is reported.
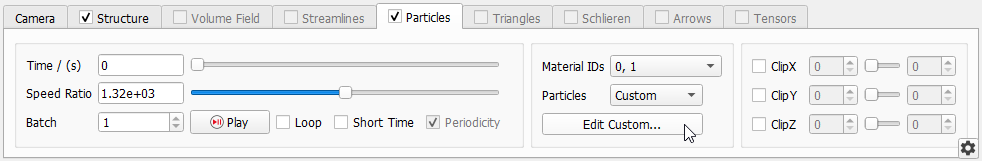
The Particles tab is activated in the Visualization panel above the Visualization area, where the structure and the particles are displayed. Turn off the structure model by unchecking View → Structure in the menu bar. Click Play to visualize the movement of the diffusing particles. This will show a large number of particles moving around. To have a closer look at a single particle, choose Custom in the Particles pull-down menu. Then, click the Edit Custom… button (that appears underneath) to open the Custom Particle Selection.
With the settings shown below, the trajectory and movement of a single particle (number 212) can be visualized.
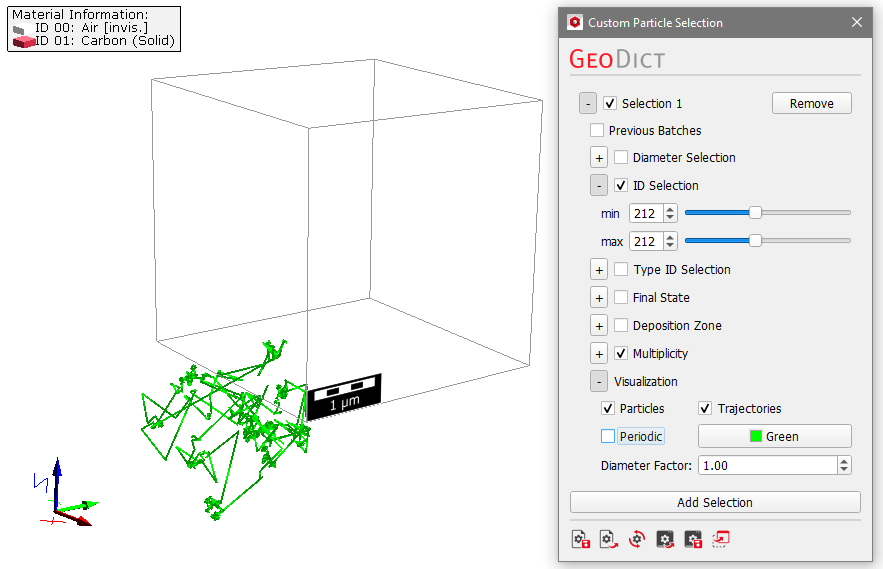
Due to the periodic boundary conditions for the computations, a particle trajectory may leave the domain and enter on the opposite side multiple times. If Periodic is checked, the trajectory is shown completely inside of the surrounding bounding box, if Periodic is unchecked (as in the shown example), the trajectory may be shown outside of the bounding box.