Results
The Results tab gives access to the computed values for the parameters calculated by the selected ElastoDict process. The Results tab is divided into three subtabs:
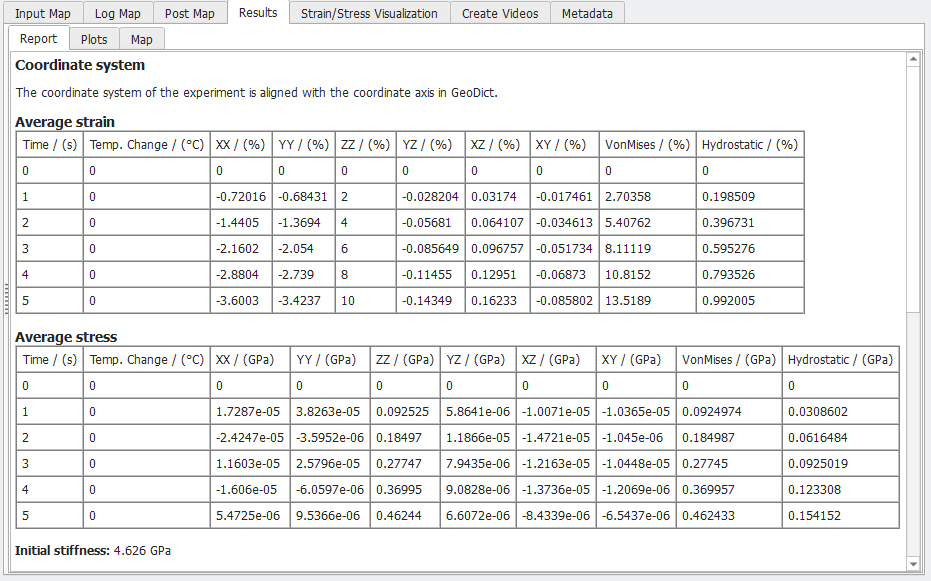
- The Report subtab shows the Average Strain (displacement gradient when using geometric nonlinearity) and Average Stress values in the experiment.
- The Plots tab contains three plots:
The first tab shows the strain-stress diagram by default. The parameters on the X/Y-Axis and the corresponding units are specified to the left of the plot. Click Apply to update the plot.
The second tab shows the Convergence for each load step of the simulation by displaying the relative error for each iteration.
By right-clicking on a plot, it is possible to adjust the plot settings, for example, the font sizes, data range etc. Additionally, the plot can be saved as an image and the data can be saved as a *.txt file.
- The Map subtab contains all result values like strains and stresses for all load steps or volume fractions for the deformed structure.
