Result File
The handling of the result file works analogous as for ElastoDict-Deformations. Only the features specific for the flexural test are explained here in detail.
 Results
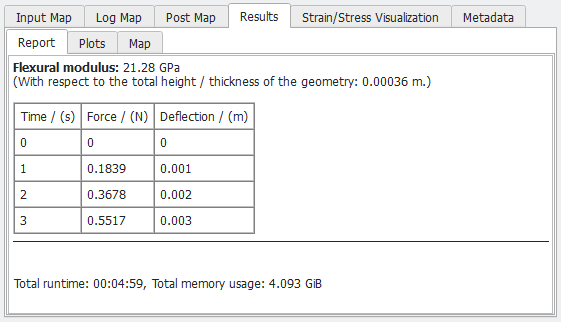
The Results - Report tab contains a table with the forces and corresponding deflections in the experiment as well as the flexural modulus, which is computed based on the first step of the simulation.
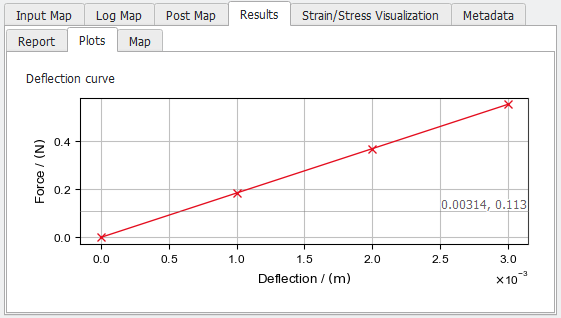
Under the Plots subtab the forces and corresponding deflections in the experiment are plotted.
|
Strain/Stress Visualization
In the Strain/Stress Visualization tab, the computed result fields (*.das) and deformed geometries (*.gdt) can be loaded into GeoDict for visualization.
In the example below, a flexural test is done on a beam with a material structure as shown on the left. On the right, the distribution of the strain in X-direction is shown, and it is visible that the compressed on the top (negative strain, colored in blue) and stretched on the bottom (positive strain, colored in red).
Make sure, that all displacements, strains and stresses of interest are chosen in the Output tab to be written in the result files.
The simulation is based on the strain or stress gradients in the beam in the load direction. Therefore, it is not possible to see the bending in the results. This corresponds to the idea of analyzing a very small part of the beam.
|