Plots
Under the Plots tab various result plots are available:
 Pressure plot
Under the Pressure tab, a graph of the changes in Pressure across the layers is shown. There is one plot for each selected Computational Direction. Here, only the Z-direction was selected:
|
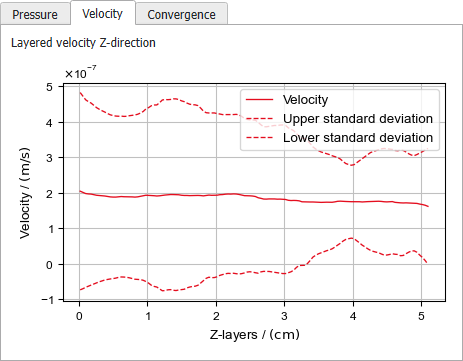
Velocity plot
Under the Velocity tab, a graph of the changes in Velocity across the layers is shown. Here, the velocity component in flow direction is shown. There is one plot for each selected Computational Direction. Here, only the Z-direction was selected: The velocity component in the chosen direction is averaged over the pore voxels for each layer in this direction.
|
Convergence
The Convergence tab plots the computed permeability at each iteration. For the Error Bound criterion, it also shows the predicted value. In this case, the solver stops when the computed solution and the prediction are within the selected relative error.
|