Plots
Under the Plots tab various result plots are available:
 Pressure
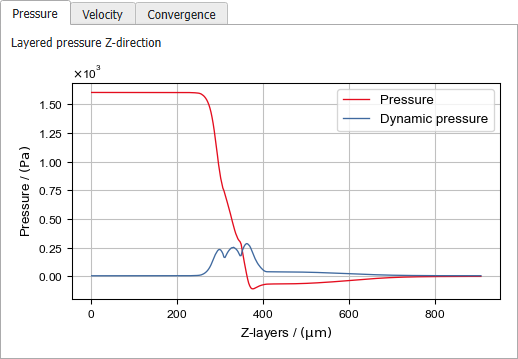
Under the Pressure tab, a graph of the changes in Pressure across the layers is shown. There is one plot for each selected Computational Direction. Here, only the Z-direction had been chosen for computations.
|
Velocity
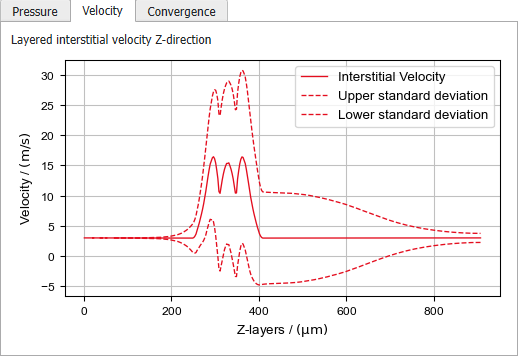
Under the Velocity tab, a graph of the changes in Velocity across the layers is shown. The velocity component in the chosen direction is averaged over the pore voxels for each layer in this direction. Therefore, the velocity matches the average velocity in the empty inflow and outflow region.
|
Convergence
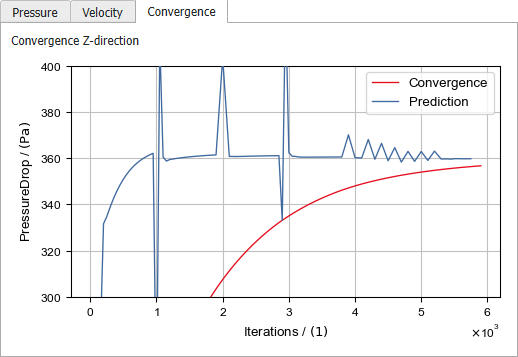
The Convergence tab plots the computed mean velocity, flow rate or pressure drop at each iteration. For the Error Bound criterion, it also shows the predicted value. In this case, the solver stops when the computed solution and the prediction are within the selected relative error.
|
Residual
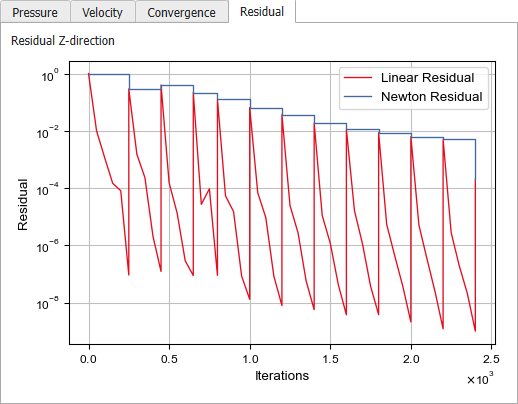
The Residual plots tab shows the Linear Residual and the Newton Residual at given Iteration values. The Newton Residual is defined as the residual while solving non-linear equations with Newton’s method. The Newton residual curve changes, when the equation is solved, while the linear residual changes with every iteration while solving a linear equation system.
This plot is available only when the Krylov method is used.
|