3D-Image Report
The 3D-Image Report app generates a report from 3D gray value images as a PowerPoint presentation. To learn more about creating PowerPoint presentations, refer to GeoPy Scripting or check the Python scripts in the scripts folder of this GeoApp (\GeoDict 2026\GeoApps\General\Report and Image)
|
Modules needed to run this GeoApp: |

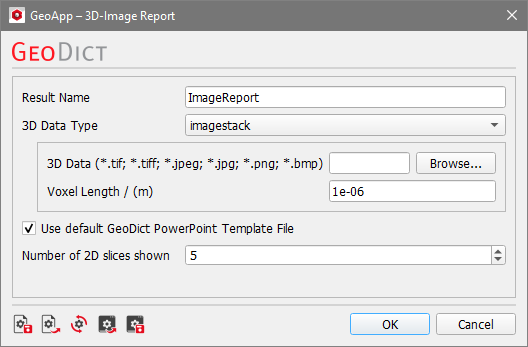
Click Edit to open the 3D-Image Report Parameters dialog.
The input parameters include Result Name, 3D Data Type, Voxel Length, Use default GeoDict PowerPoint Template File, and Number of 2D slices shown. Please find detailed explanations of the parameters and how to customize the PowerPoint Template File in our GeoApp for 3D-Image PowerPoint reports tutorial.
Browse for the dataset and select the file. For image stacks, select one of the images in the stack folder. Adjust the parameters as desired. Click OK to close the dialog, go back to the GeoApp section, and click Run to start the generation of the report.
Results
After the GeoApp run is finished, the generated PowerPoint report is saved to the result folder. The presentation contains a title slide, as well as the defined number of 2D image slices for each of the Z-, Y-, and X-directions. Three 2D videos can be accessed by clicking on the corresponding slide. The videos display the complete image data from each view axis. Carefully examining the PowerPoint slides in a loop may reveal previously unknown image artifacts.
