Compute Metrics
With Compute Metrics you can access statistical properties of the volume field.
Enter a Result File Name (*.gdr) to under which the results are saved. Then, select on which of the loaded Volume Fields the properties should be computed. The Random Seed influences the results of Autocorrelation and Correlation Length.
Below, choose which metrics should be computed.
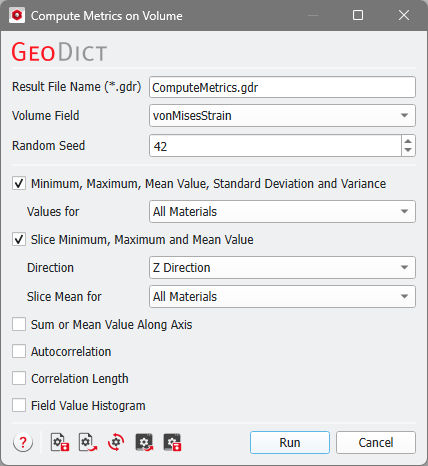
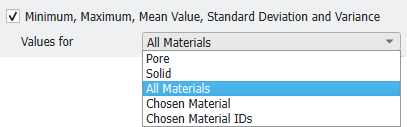
Minimum, Maximum, Mean Values, Standard Deviation, and Variance can be computed for either Pore, Solid, All Materials, Chosen Materials, or Chosen Material IDs.
Minimum, Maximum, and Mean Values can also be determined slice-wise for a chosen direction and Pore, Solid, All Materials, Chosen Materials, or Chosen Material IDs.
Additionally, you can compute the Sum or Mean Value Along Axis for a chosen direction and Pore, Solid, All Materials, Chosen Materials, or Chosen Material IDs.
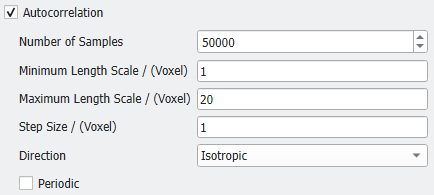
When Autocorrelation is selected, the similarity of voxels in a given distance between Minimum Length Scale and Maximum Length Scale is measured. This is similar to the MatDict command 2-Point Correlation.
The Correlation Length is a measure on which length scale the values of the volume field change.
With Field Value Histogram a histogram of the values in the volume field is computed with respect to the entered Number of Bins.

Clicking Run computes the chosen metrics. After the run is finished, the result viewer opens and shows the results in the report tab. Additional plots are available in the Plots subtab if Slice Minimal, Maximal and Mean Value, Sum or Mean Value Along Axis, Autocorrelation, or Field Value Histogram are selected.
