Preparations
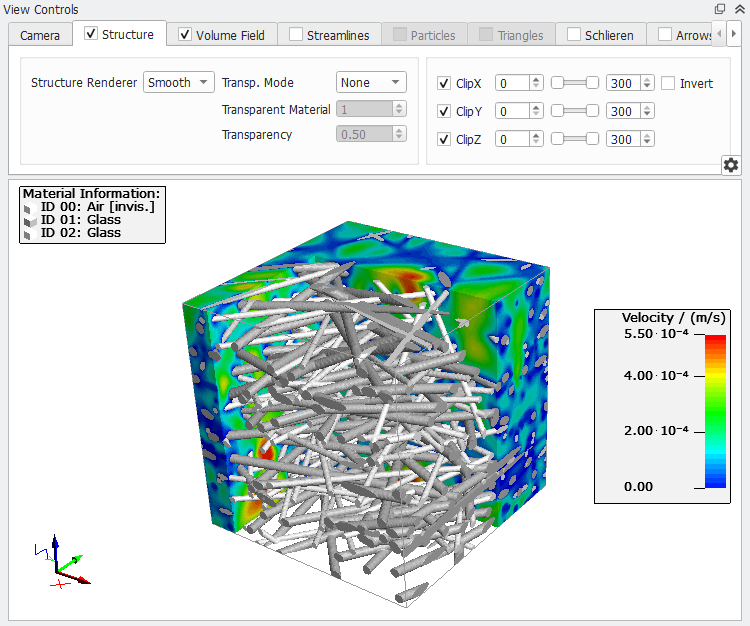
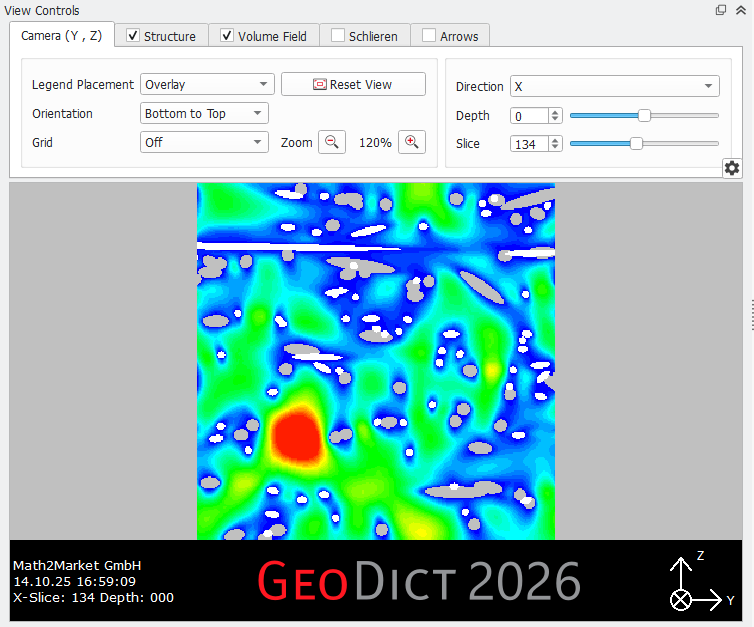
When you load image data into GeoDict it is shown in the Visualization Area. The image might be of any kind of structure created with one of GeoDict’s structure generators, or imported with the Import modules, or result data from GeoDict’s predictor modules. Above the visualization area, the View Controls panel is one of the access points to change the visualization of the image. Everything which can be loaded to the Visualization Area can then be saved as an image.
Other access points are the View menu and the Color & Visibility Settings.
The View Controls panel looks different for the 2D Cross Section (SEM) view and the 3D Rendering mode. For the 2D View and the 3D Rendering the tabs Camera, Structure, Volume Field, Schlieren, and Arrows are available. Some data from volume files can only be visualized in 3D rendering mode. Thus, in 3D rendering the additional tabs Streamlines, Particles, Triangles, and Tensors appear. Result field tabs are grayed-out if no corresponding data is loaded. Expand the View Controls panel to a new window using the  button and collapse it with
  to have more space for the visualization area.
To start the visualization of results, a volume file must be loaded through File → Load Volume Field… or Load Particles… in the menu bar, or directly by loading from the Visualization tab of the GeoDict Result Viewer.
More detailed information about visualization in GeoDict can be found in the Visualization chapter.