Data Visualization
The detected connected components can be visualized in GeoDict in two different ways, as index image or as structure file.

Index Image of Components
The first two options load the index image in *.g32 or *.leS format, depending on the choice made in the settings dialog. These are 3D images, where for every voxel the index number of the corresponding component is stored. For example, if the structure consists of 1027 components, the file will contain numbers from 1 to 1027. Click Load *.g32 or Load *.leS to load the index image.
|
Know how! If the Visibility options dialog opens, we recommend to set the structure visualization to invisible by clicking Yes, so that the indices can also be seen in the solid parts of the structure. 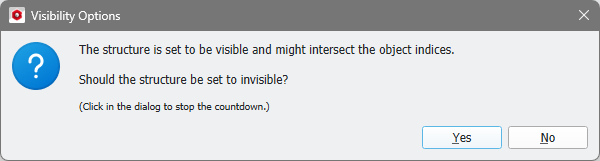 |

In the index image visualization, every index is highlighted with a different color. The example below shows the index image of a closed-cell foam in 2D, where every cell of the foam belongs to another connected component of the pore space.

Components as Structure
The third option is to load the components as a structure file in *.gdt file format. Every component is assigned a Material ID based on the index number as shown in the following picture.

Be aware, that this format supports only 256 different Material IDs. This might lead to neighboring components getting assigned to the same ID. In the example, every 255th foam cell gets assigned to the same ID as the cell walls, and therefore seems to disappear in the visualization.
