Plots
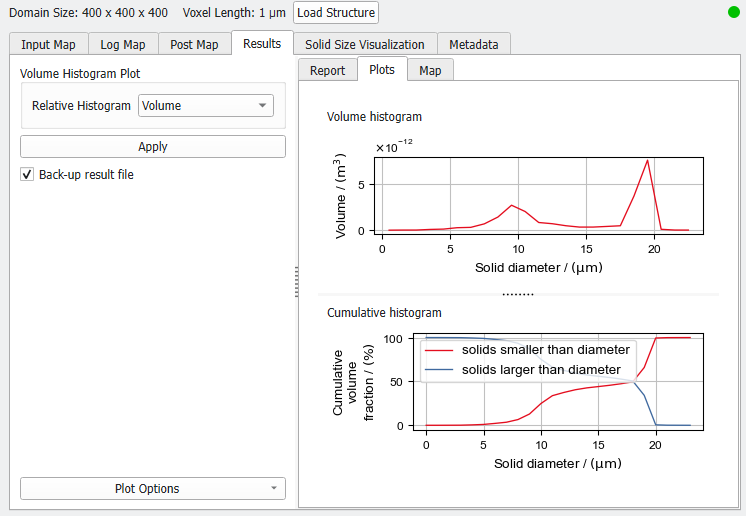
Under the Results – Plots subtab, a relative and a cumulative histogram is plotted.
Relative Solid Size Histogram
The content of the relative histogram is defined by the selection in the Volume Histogram Plot section of the Post-Processing panel on the left of the Result Viewer. The solid diameter is plotted either against the Volume, Volume Fraction, or the differential pore volume (). After choosing the histogram and clicking Apply…, the plots change accordingly.
Cumulative Solid Size Histogram
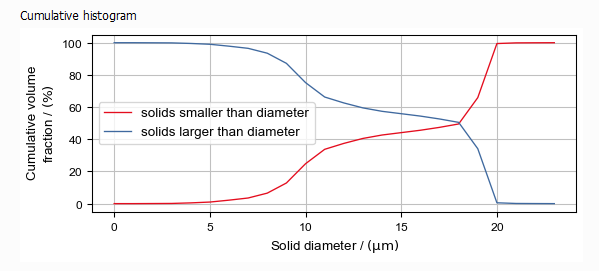
In the Cumulative Histogram plot, the red curve shows the volume fraction of solids smaller than a given diameter and the blue curve shows the volume fraction of solids larger than or equal to a given diameter. Both curves sum up to 100% for any given diameter.