Results
After the Lineal Path Length Distribution calculation is finished, the resulting files are saved in the project folder and a Result Viewer with the GeoDict result file opens automatically. The created GeoDict result file (*.gdr) contains five tabs. The computational results are shown under the Results tab. The other four tabs (Input Map, Log Map, Post Map, and Metadata) display additional information about the computation.
Find more details on the general functionalities in the Result Viewer user guide.
Report
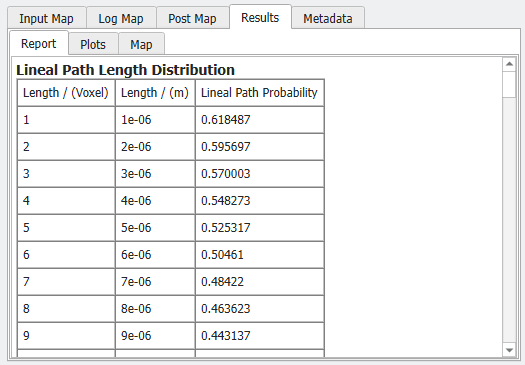
In the Results – Report tab a table shows for each length (given in voxel and meters) the computed Lineal Path Probability. This is the probability that a lineal path of this length completely lies in the chosen Material ID.
Plots
In the Report – Plots subtab, the values from the table are graphically shown as Lineal Path Length Distribution graph. In this example, the Lineal Path Length Distribution was computed for the pore space (Material ID 00).
