Particle Visualization
To visualize the initial and final positions of particles, track their trajectories, and study the flow of the fluid through the filter structure, select the Particle Visualization tab.
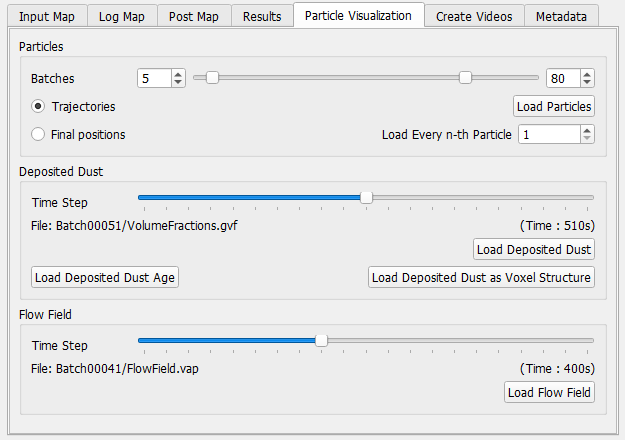
Particles
In the Particles panel, select one or several succeeding batches with the sliders. Select Trajectories to animate the particle motion from inflow to outflow or deposition place. If a large number of particles was simulated, loading all the trajectories at once is memory consuming and may not be possible. Loading only the Final positions does not allow to animate the particle motion, but is less memory consuming. Memory consumption may also be reduced by visualizing only a fraction of the simulated particles per batch by loading only Every n-th Particle.
Clicking Load Particles loads the selected trajectories or final particle positions and displays the particles in the viewport.
When visualizing results of filtration simulations on the pleat scale or filter element scale, it is often necessary to enlarge the particles Diameter Factor for better visibility, because particle diameters are small in comparison to the structure model and therefore difficult to depict when shown in their original size.
Because of the need to enlarge particles and because of the fact that those particles show only a representative particle when using Multiplicity, the build-up of a filter cake cannot be visualized properly on the filter element scale by visualizing every single particle. Also, the total amount of particles simulated would make this task impossible or very demanding for the computer’s graphic card. Therefore, it is recommended to use the Deposited Dust result fields to visualize the development of the filter cake, as explained below.
Deposited Dust
Use the slider to select the Time Step. There are three options to visualize the deposited dust from the simulation:
- With Load Deposited Dust, a result field (*.gvf) is loaded that contains for every voxel a single double value in the range [0,1], describing the volume fraction of the voxel filled with dust particles.
- With Load Deposited Dust as Voxel Structure, the volume field is converted to a voxel structure.
- With Load Deposited Dust Age, a result field is loaded that contains for every voxel a single integer value describing how many batches ago this particle was deposited. Voxels filed in the last batch contain the value zero, voxels filled in the previous batch the value 1, and so on...
Clicking on the appropriate button loads the data and displays the deposited dust in the viewport.
Flow Field
Use the sliders to select the corresponding time step. Click Load Flow Field to load the result and refer to the Visualization handbook for details.