Particle Visualization
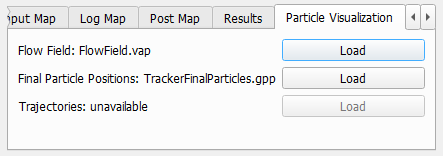
On the Particle Visualization tab, it is possible to load and visualize the computed flow field or the computed particle trajectories and particle end positions. The options available here depend on the choices made on the Output tab.
During filter efficiency simulations, no filter cake is created, and all particles move independently from each other. Nevertheless, a large number of possible trajectories is computed for all particle sizes to get statistically meaningful efficiency results. Therefore, visualization of the particle end positions and trajectories will not give a realistic impression of a filtration process. Rather, the trajectories show all the possible pathways a dust particle may take.
Clicking Load imports the particle data and displays the particles in the viewport.