NMR
The NMR app computes the T2 relaxation curve of a simulated NMR experiment on the current 3D structure.
|
Modules needed to run this GeoApp: AddiDict |

After loading a structure, click Edit to open the NMR parameters dialog.
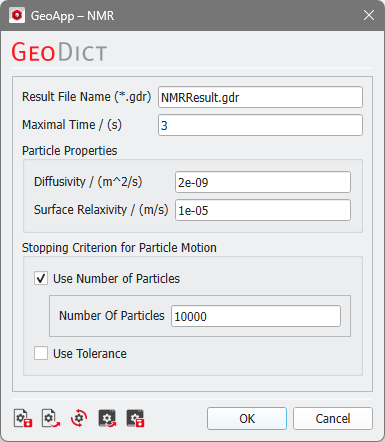
First, define the Result File Name.
The Maximal Time is the time duration of the particle tracking.
Under Particle Properties define the Diffusivity of particles in the fluid (the default 2e-9 m2/s refers to the self-diffusion coefficient of water) and the Surface Relaxivity of the pore wall material.
As Stopping Criterion for Particle Motion either choose Use Number of Particles (the number of walkers to be simulated) or Use Tolerance (give the result deviation tolerance, then particles are added until the tolerance is reached).
Two NMR simulation examples, one for a Bentheim sandstone and the other for an Obernkirchen sandstone are found in the tutorial Random-walk method to simulate T2 of NMR.
Click OK to close the dialog, go back to the GeoApp section, and click Run.
Results
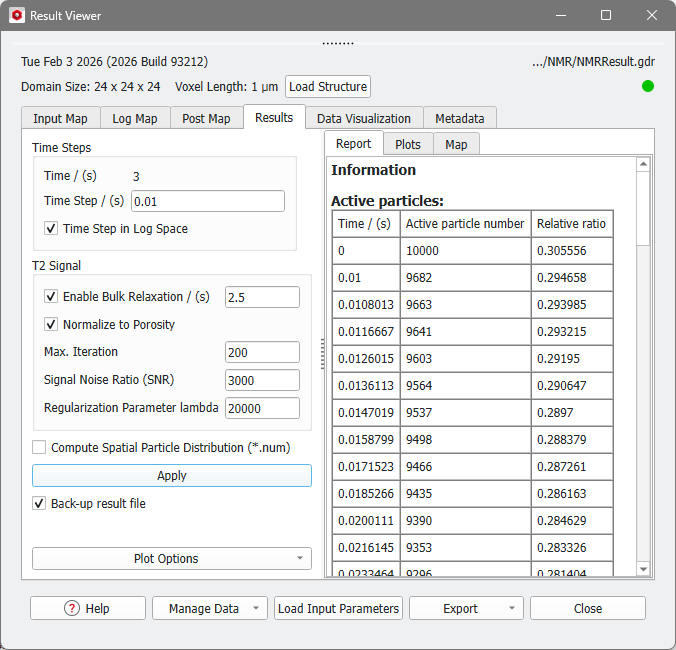
When the simulation finishes, the Result Viewer of the result file (*.gdr) opens automatically.
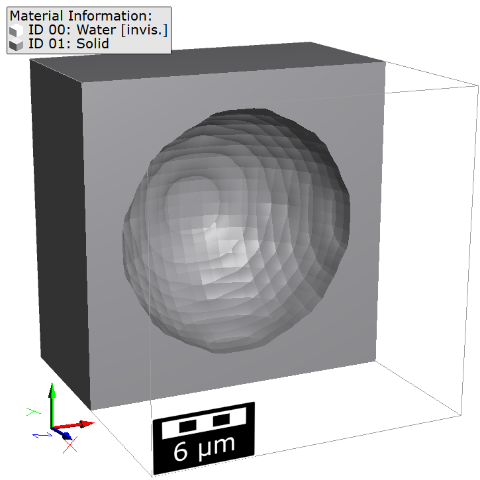
In the example, an NMR experiment was run on a cube with one spherical pore; here clipped in Z-direction.
The Results - Report subtab of the Result Viewer shows the table for the number of Active particles and the resulting relative ratio vs. the simulation time.
In the Results - Plots subtab, the plot of Active particle ratio, corresponding to the values of the Active particles table, the plot of T2 Distribution, and T2 Weighted error are shown. For more details on the results, refer to the NMR tutorial linked above.