Plots
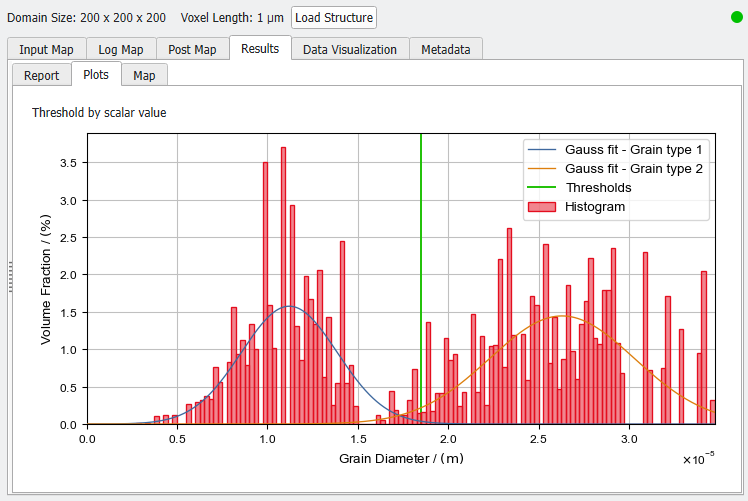
The Plots tab shows the histogram of the estimated grain diameters. Additionally, the fitted Gauss functions for the different classes are plotted.
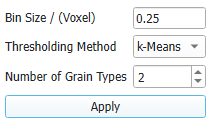
Post-processing widget
In the post-processing panel on the left, you can choose the Bin Size to define the granularity of the histogram. Use the Thresholding Methods and Number of Grain Types to classify the grains into different classes based on their diameter by fitting a Gauss function to the estimated diameters. Clicking Apply immediately changes the results in the Map subtab, and therefore the tables in the Report subtab and the histogram in the Plots subtab. Collapse the Post-Processing Widget by pulling it to the left.
 Bin Size
Changing the Bin Size affects the resolution of the histogram in the Plots tab and the histogram table in the Report tab. A too large Bin Size leads to a “blocky” histogram, while a too small Bin Size leads to a volatile and noisy histogram. The Bin Size should be chosen so that the histogram is smooth and detailed. The effect of the Bin Size on the histogram is illustrated below.
|
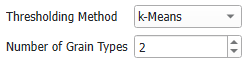
Thresholding Method and Number of Grain Types
You can classify the grains in the structure into different types based on the estimated diameter.
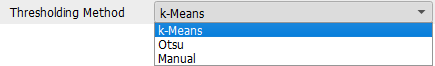
To determine the threshold value, three Thresholding Methods are available:
- k-Means: uses the k-Means algorithm to find thresholds for the chosen Number of Enter value Types.
- Otsu: uses the Otsu algorithm to find thresholds for the chosen Number of Enter value Types.
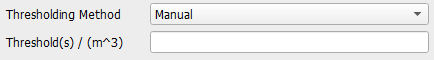
- Manual: define your own thresholds by writing a comma-separated list of thresholds into Threshold(s). You implicitly define the number of pore types by the number of thresholds you enter, e.g, if you enter two threshold values this will result in three pore types.
After clicking Apply, the Grain Type Analysis table is updated and shows for each type the relevant parameters. In the Plot tab, the Gauss fit of each grain type and the threshold values are added to the histogram plot. This allows you to control if the computed thresholds fit to the grain diameter distribution or need to be adapted.
Based on these diameter classes, the structure is automatically segmented and can be loaded from the Data Visualization tab
|