Report
The Report tab shows statistics about the estimated grain diameters.
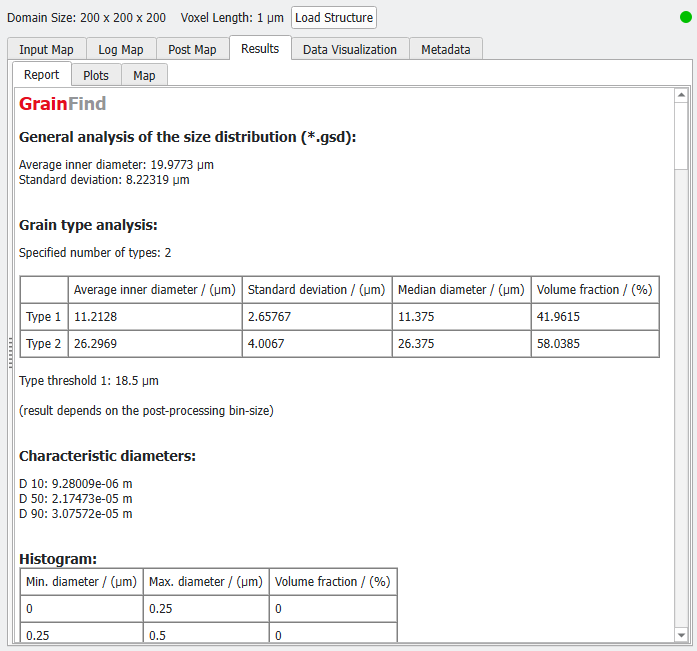
 General analysis of the size distribution (*.gsd)
Here, the computed Average inner diameter of all grains and the Standard deviation are given. Both values are computed from the values in the GeoDict size distribution (gsd) file, where only the analyzed materials are taken into account. You can load the *.gsd file from the Data Visualization tab.
|
Grain type analysis
The statistical parameters (Average inner diameter, Standard deviation, and Median diameter) of the fitted Gauss function for each class are displayed in this table. Additionally, the volume fraction for each class is given.
If more than one class is reported, the Threshold(s) used to determine the types are given below the table.

|
Note! These values depend on the entered Bin Size!
|
|
Characteristic diameters
The characteristic diameters D10, D50, and D90 are the diameters such that 10%, 50%, or 90% of all grains have a smaller estimated diameter than the corresponding value.
|
Histogram
The histogram table contains the values from the histogram plot, where each row contains the data of one bin. The diameter of the grains in one bin is between the minimum and maximum diameter. The volume fraction shows how many grains are contained in a bin. Of course, the data in the table changes when entering another Bin Size.
|