The Density Distribution table describes the probability of a random center taking certain position values in Z-direction.

|
Note! The center density distribution should be defined with monotonously increasing Z-values. If Z is non-monotonic or monotonously decreasing, the values are ordered as needed after closing the dialog.
|
When checking Use Relative Position in the density distribution table, the left column values from 0 to 1 correspond to locations in the structure. In the Z-direction, the value 0 is at the origin and the value 1 is at end of the domain.
The right column assigns relative density values at these locations. The value 20 means that there are ten times more objects in Z = 1 than in Z = 0.1, with a density value of 2. The object density increases and decreases linearly between the given locations in the Z-direction.
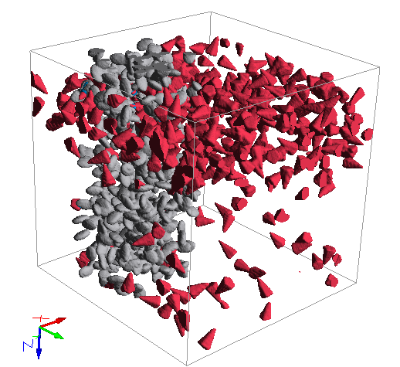
Observe how, with the values entered in the table (0.1 → 20, 0.5 → 0, and 1 → 2), most pyramids occupy an area in the structure near the Z-origin (Z = 0.1), then there is an area almost empty of pyramids in the middle (Z = 0.5), and only some pyramids are at the end of the domain in Z-direction (Z = 1).
With Use Relative Position unchecked, the left column values of the density distribution table correspond to absolute locations in the structure.
In the Z-direction, in a structure of size 200 x 200 x 200 µm, the value 0 is at the origin and the value 200 is at the end of the domain. The right column assigns density values at these locations, where 0 means that pyramid centers are absent at that location, and 1 means that pyramid centers are present at the location.
The object density increases and decreases linearly between the given locations in the Z-direction. Therefore, in the following example, the position 50, where a sharp transition is desired, is given twice: once with positive density and once with density of 0.
As before, with orientation, the distribution of centers can be separately set for each object type so that differently distributed object types may coexist within the same structure.
In the following example, observe that the gray ellipsoids are distributed Uniformly in Box, whereas the red pyramids follow a Density Distribution.
|