Results
The generated structure is shown in the visualization area. Learn more about visualization in GeoDict in the Visualization chapter.
The result file is automatically opened in the Result Viewer and shows structure statistics in the Results-Report and Results-Plot tabs. Additionally, it offers 3D Data Visualization options depending on the generation settings. Find more information on GeoDict result files in the Result Viewer chapter.
Results
 Report
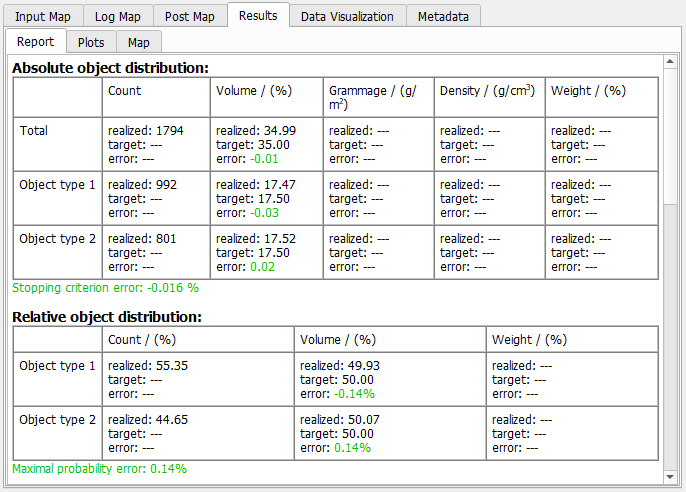
The first two tables show the Absolute and Relative object distribution for all object types.
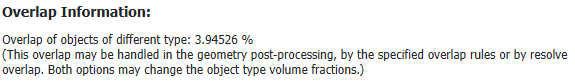
Afterwards follows a section regarding the overlap between different object types.
Then, the realized, the target, and the error direction tensors for all object types are given. Find below different examples of the direction tensors with isotropic orientation, anisotropy parameters, or orientation tensors.
|
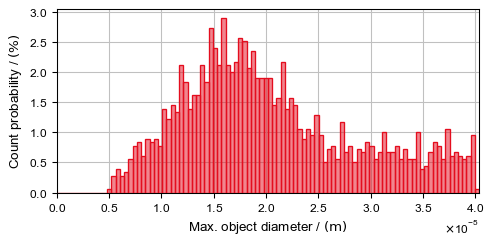
Plots
A plot showing the objects' maximum diameter distribution is shown.
|
Data Visualization
Depending on the chosen parameters under the Data Visualization tab the following results can be visualized in 3D.
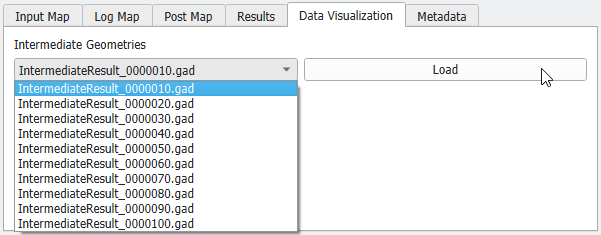
Intermediate Geometries
When selecting Save Intermediate Results every # Objects under the Result Options tab, you can open the intermediate geometry files (*.gad) after selecting them in the pull-down menu.
|
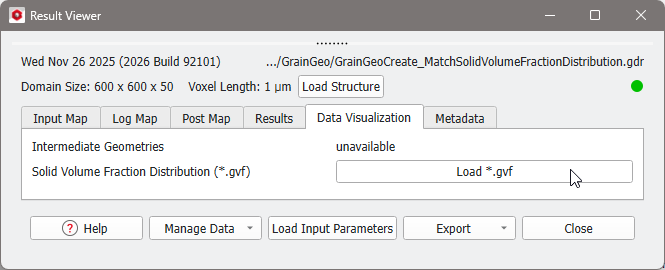
Solid Volume Fraction Distribution
If Match Solid Volume Fraction Distribution is checked in the Generation and Overlap Mode panel under the Create Options tab, the volume distribution field (*.gvf) file is saved. Click Load *.gvf to load the volume field to the visualization area. Learn more about volume field visualization in the Visualization User Guide.
|