Options
The Connected Components dialog opens when clicking the Edit… button and includes the General Options and the Post-Processing tabs.
At the top of the dialog, enter the Result File Name. The result file is saved in the chosen project folder (File → Choose Project Folder in the menu bar).
General Options
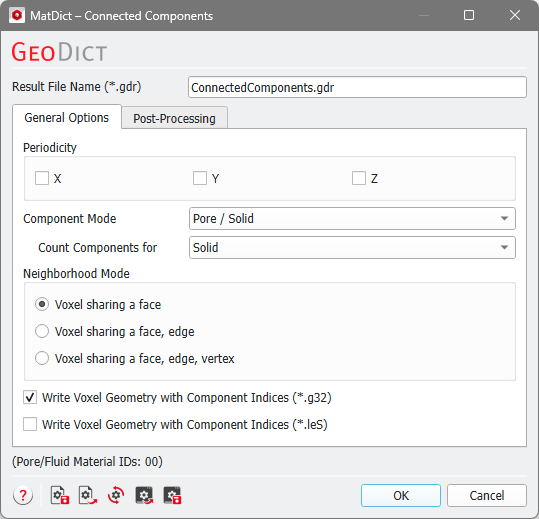
In the Periodicity panel, periodic boundaries can be set in the three spatial directions. If a box is checked, every voxel located on the corresponding boundary of the domain is connected to a voxel on the opposite side of the domain. Thus, components can be connected across the domain boundary. If a box is not checked, no connections exist across the domain boundary.
If the Component Mode is set to Material ID, all voxels belonging to one component must have the same Material ID. If it is set to Material, all voxels belonging to one component must belong to the same material. If it is set to Pore / Solid, the distinction happens only between solid or pore voxels. Thus, in the Pore / Solid mode, voxels with different Material IDs may form one component. For your convenience, all Material IDs which denote pore space are shown at the bottom of the dialog.
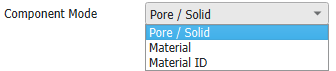
While the Component Mode defines which parts may belong to one component, with Count Components for you can set what is counted and reported. Always available are Pore, Solid, and Pore and Solid. The additional options depend on the selected Component Mode, so it is possible to count components only for a Chosen Material or for Chosen Material IDs.
The Neighborhood Mode defines if two voxels are connected (and belong, depending on the component mode, to the same connected component) or not. Voxels can be connected through faces, edges, and corners (vertices).
The different Neighborhood Modes are explained using this example.

Two voxels can be connected through faces, edges, and vertices (corners). Voxels that share a face, do also share edges and corners, as you can observe for the red and the blue voxel. The blue and the green voxel share an edge and the corner points of this edge. Finally, the blue and the yellow voxel share only one vertex (corner point).
Thus, checking Face is more restrictive than choosing Face or Edge, and this is more limiting than selecting Face, Edge, or Vertex.
When choosing the Neighborhood Mode Face only the red and the blue voxel are connected.
When choosing Face or Edge the red and the blue voxel and the blue and the green voxel are connected.
Finally, if Face, Edge, or Vertex is chosen, the red and the blue voxel, the blue and the green voxel and the blue and the yellow voxel are connected.
When checking Write Voxel Geometry with Component Indices (*.g32), the indices of the connected components are saved as objects in a .g32 file. This file can be opened in the Data Visualization tab in the Result Viewer.
When checking Write Voxel Geometry with Component Indices (*.leS), the object indices are stored in an *.leS ASCII file, which can also be opened in the Data Visualization tab. This file is human readable, but will be considerably larger and slower to read into GeoDict than the *.g32 file. Therefore, if you need the index file for further processing in GeoDict, we recommended to use the *.g32 format.
Post-Processing
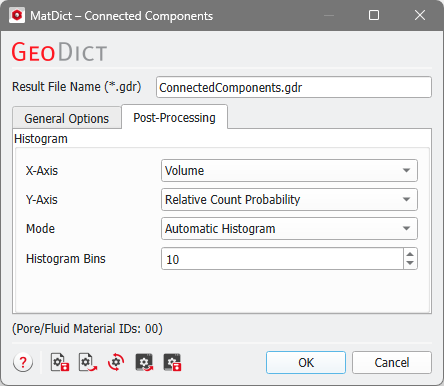
Under the Post-Processing tab, the settings used to create the histogram of the analyzed components are defined. It is possible to modify those settings after the computation has been run in the Result Viewer.
The X-Axis pull-down menu allows choosing whether the components should be classified based on volume (Volume) or based on volume equivalent sphere diameter (Equivalent Diameter).

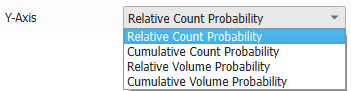
For the Y-Axis pull-down menu, the Relative Count Probability provides the number of components in each bin normalized to the total number of components. The Cumulative Count Probability is the sum of the Relative Count Probability over all bins starting from the bin with the smallest value. Relative Volume Probability gives the volume of the components within one bin normalized to the total volume of all components. The Cumulative Volume Probability sums up the Relative Volume Probability of each bin of the histogram starting from the smallest one.
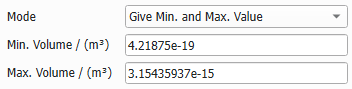
The histogram Mode offers the choice between generating an Automatic Histogram without further specifications or to Give Min. and Max Value for the parameter defined in the X-Axis pull-down menu (Volume or Equivalent Diameter).

In the latter case, either Min. Volume and Max. Volume or Min. Diameter and Max. Diameter (depending on the choice for X-Axis) can be directly entered here.
The number of Histogram Bins determines the number of rows in the Enter value table and the number of bars in the plot.

