Results
After the 2D Density Map calculation is finished, the resulting files are saved in the project folder and a Result Viewer with the GeoDict result file opens automatically. The created GeoDict result file (*.gdr) contains five tabs. The computational results are shown under the Results tab. The other four tabs (Input Map, Log Map, Post Map, and Metadata) display additional information about the computation.
Find more details on the general functionalities in the Result Viewer user guide.
In the Results - Report tab, the minimal, maximal, and mean values of the computed parameter (here: Grammage) and the standard deviation are given. Below, a table shows the computed density distribution for the chosen number of Histogram Bins.
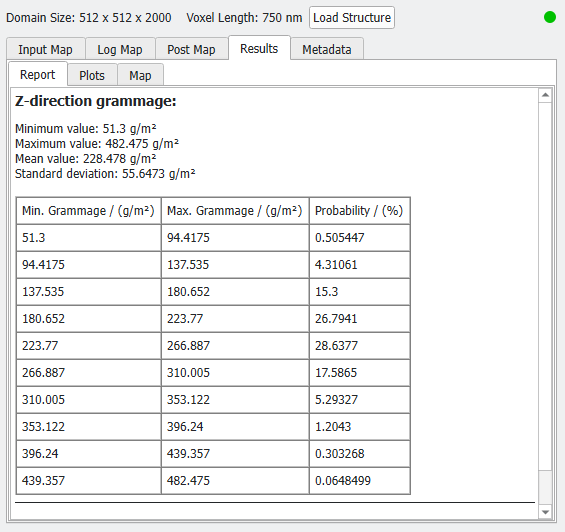
In the Results – Plots tab, the table entries are additionally available as a Histogram plot. The 2D Density Map subtab shows the computed result, where each pixel in this plane shows the average of the chosen property in the direction of interest at this position.
