Report
At the top of the Report tab, in the Layer analysis section, the SVP of the entire structure is reported.
Below are the analysis results of the chosen directions. In this example, only the Z-direction was selected as through direction, therefore, only a Z direction analysis section is contained in the report. Initially, the specific solid volume and the specific pore volume are reported.
Following this, a table displays computed values from the thickness estimation algorithm for the selected fits. The first three rows showcase the thickness of the identified inlet, medium, and outlet, with their cumulative sum equating to the domain size in the Z-direction. The fourth row provides the SVP of the identified medium. The nodes correspond to the piecewise linear approximations that are illustrated in the thickness estimation input dialog, which indicate the coordinate in the through direction and the corresponding SVP. The final row shows the error of the SVP approximation in the L2 norm. Below the table, the chosen Thickness SVP threshold is reported.
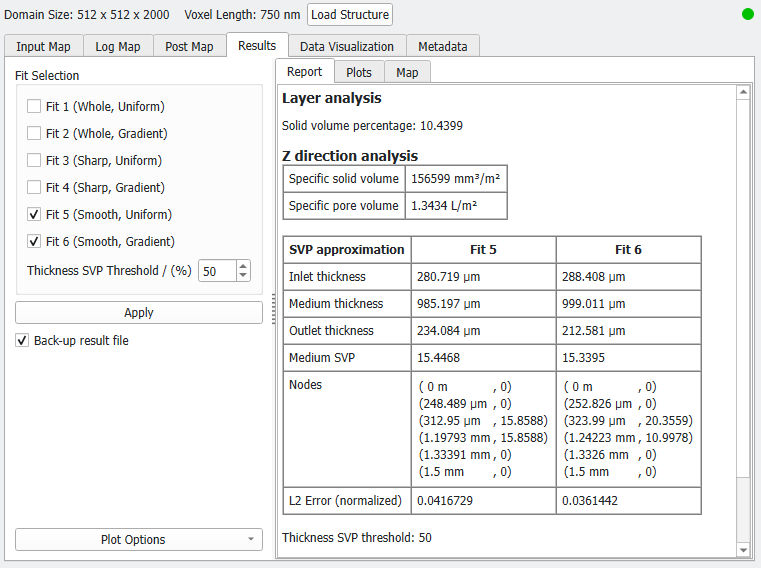
In the context menu shown on the left, the Fit Selection can be modified and executed as a post-processing step. Additionally, computations can be repeated with a different Thickness SVP Threshold value. Click Apply… to update the results, including Report and Plots.
