Plots
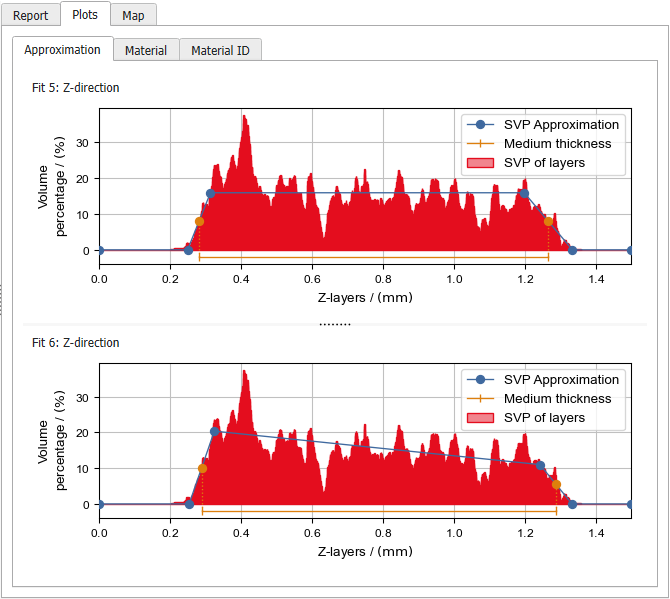
In the Plots tab, the SVP distribution corresponding to the layers of the through direction, their piecewise linear approximation, and the estimated medium thickness are visualized under the Approximation subtab for each selected fit. If exactly two fits are selected, two stacked plots will be displayed for comparison purposes. Otherwise, if three or more fits are chosen, you can select the plot you wish to view from the pull-down menu.
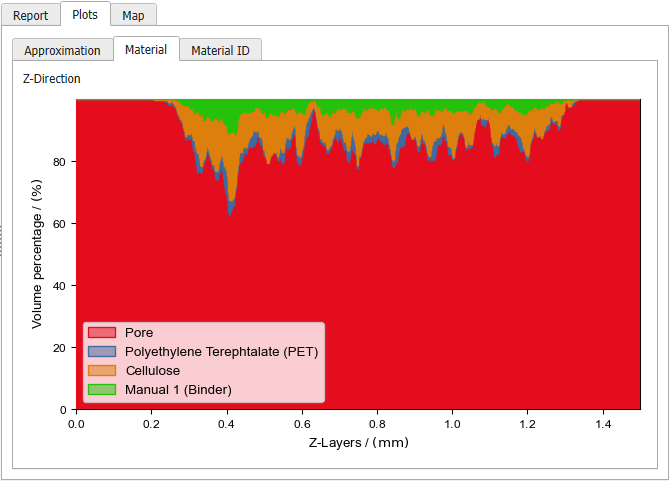
Furthermore, under the Material subtab, plots of the volume percentage of all existing materials for the layers in the analyzed direction are shown.
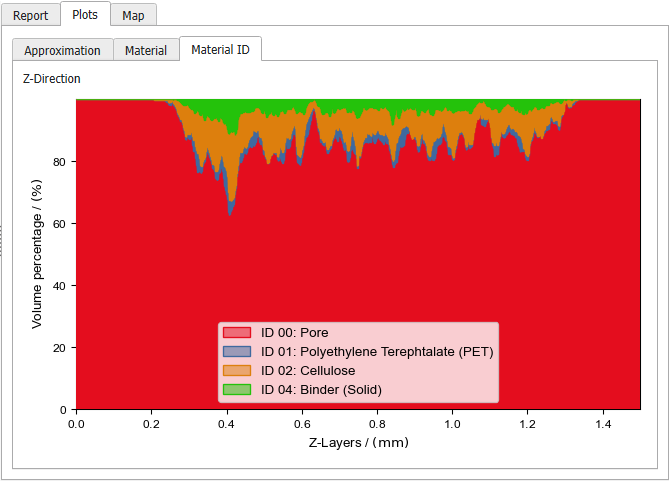
Under the Material ID subtab, plots of the volume percentage of the different Material IDs are shown. The plots differ only from those in the Material subtab if several Material IDs are assigned to the same material.