Results
After the solver run has finished, the Result Viewer opens immediately. The results are similar as seen for the Capillary Pressure Curve, but some more options are additionally available which are special for the MICP, such as the pore throat size distribution.
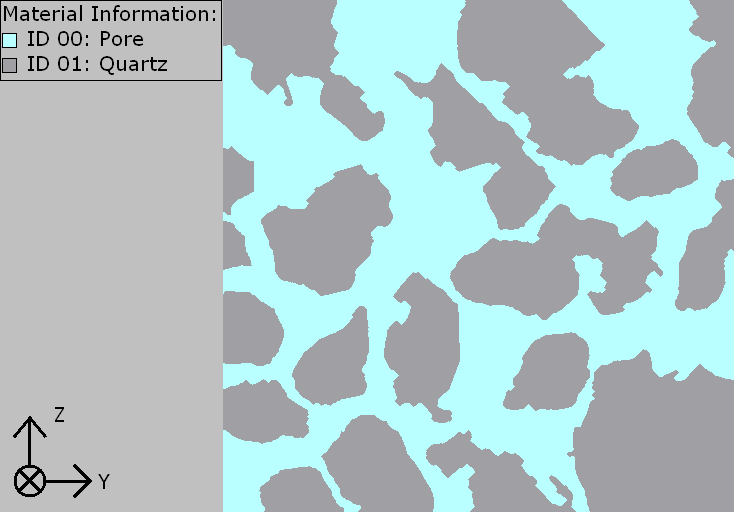
In the example, the calculations of Mercury Porosimetry & Capillary Pressure are run on a porous structure with 54% SVF, originated from Berea sandstone. A 2D cross-section view of the structure is shown below.
The Results tab is the central point analysis of the results. It is grouped in three subtabs: Report, Plots, and Map. The Report tab shows diameters, curvatures and capillary pressure values for each saturation step. The Plots tab contains plot options for the analysis of the results. The Map tab contains all resulting data from the run. This data is the basis for the tables in the Report tab and for the plots in the Plots tab.
Mercury Porosimetry & Capillary Pressure Results |
|---|
|