Results
Click OK to input the entered parameters, and then click Run in the DiffuDict section to start the command. The results are immediately shown in the opening Result Viewer after the process is finished. The screenshot below shows results obtained for the GDL model (Example 1). Here, the Results - Report subtab shows:
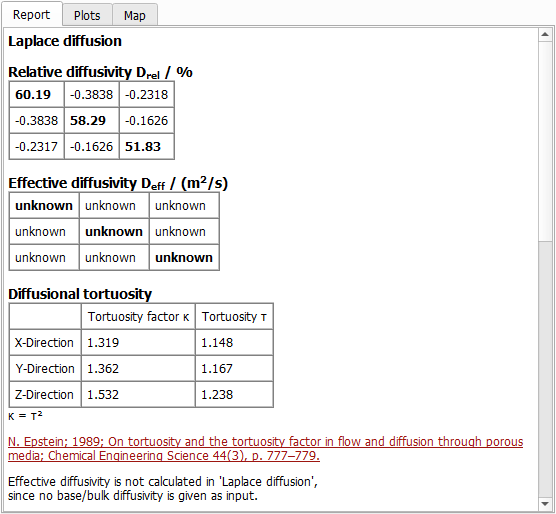
- The relative diffusivity (here called , as defined through equation (233) in %)
- The tortuosity factor as defined through equation (235)
- The geometric tortuosity
Furthermore, for each computation direction, the used solver, the number of parallel processes, the required iterations, the runtime needed to solve equation (234) , the memory usage and the applied stopping criterion are reported:
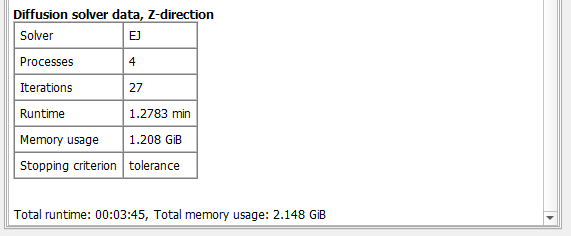
At the bottom, find the overall runtime and the total memory usage, which consists of the memory usage of the PDE solver and the GeoDict executable.
Under the Plots sub-tab, the same graphs as for the Simulate Diffusion command are plotted.