Results
Click OK to input the entered parameters, and then click Run in the DiffuDict section to start the command.
The results are immediately shown in the opening Result Viewer after the process is finished. The screenshot below shows the results obtained with the EJ solver for the GDL with an attached, unresolved MPL (Example 2):
The Results - Report subtab shows the structure’s computed Effective diffusivity.
Additionally, the Relative diffusivity and the Diffusional tortuosity are reported if the structure contains no porous materials. If the structure contains porous materials or - to be more precise - materials with different effective diffusivities, these values cannot be computed and only the homogenized effective diffusivity is determined.

Furthermore, for each computation direction, the used solver, the number of parallel processes, the required iterations, the runtime needed, the memory usage and the applied stopping criterion are reported. At the bottom, find the overall runtime and the total memory usage, which consists of the memory usage of the PDE solver and the GeoDict executable.
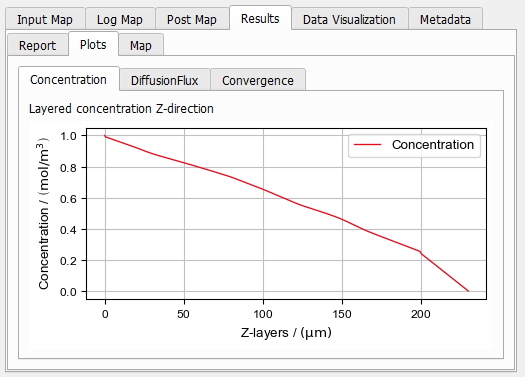
Under the Results – Plots - Concentration subtab, the average value of the concentration in each voxel layer is plotted, the screenshot shows the drop in Z-direction. At the boundary of the domain, the set boundary conditions of c=0 for Z=200 µm and c=1 for Z=0 µm are reached.
Under the Results – Plots - DiffusionFlux subtab, the average value of the diffusive flux and the standard deviation in each voxel layer is plotted. The average is taken over all pore or porous voxels which allow for diffusion.
The screenshot shows, that inside of the porous MPL the solution shows a different characteristics as in the fibrous, resolved part of the 3D model.

Under the Results – Plots - Convergence subtab, the computed diffusivity result is plotted for each iteration of the solver.