Data Visualization
Under the Data Visualization tab, the result of the diffusivity calculations can be loaded and graphically visualized. Computation Directions that were not previously selected were not computed, and, thus, are unavailable for visualization.
Select a result file and click Load. A new dialog allows to select the result fields contained in the file that should be loaded for visualization.
The .hht files contain the local concentration in every voxel. If Write Diffusion Flux into Solution File was checked, the result files also contain the diffusion flux.
Different from concentrations and fluxes computed with the Bulk (Laplace) Diffusion command, the concentrations and fluxes have a physical unit here: mol/m³ for concentrations and mol/m²/s for the diffusive flux.
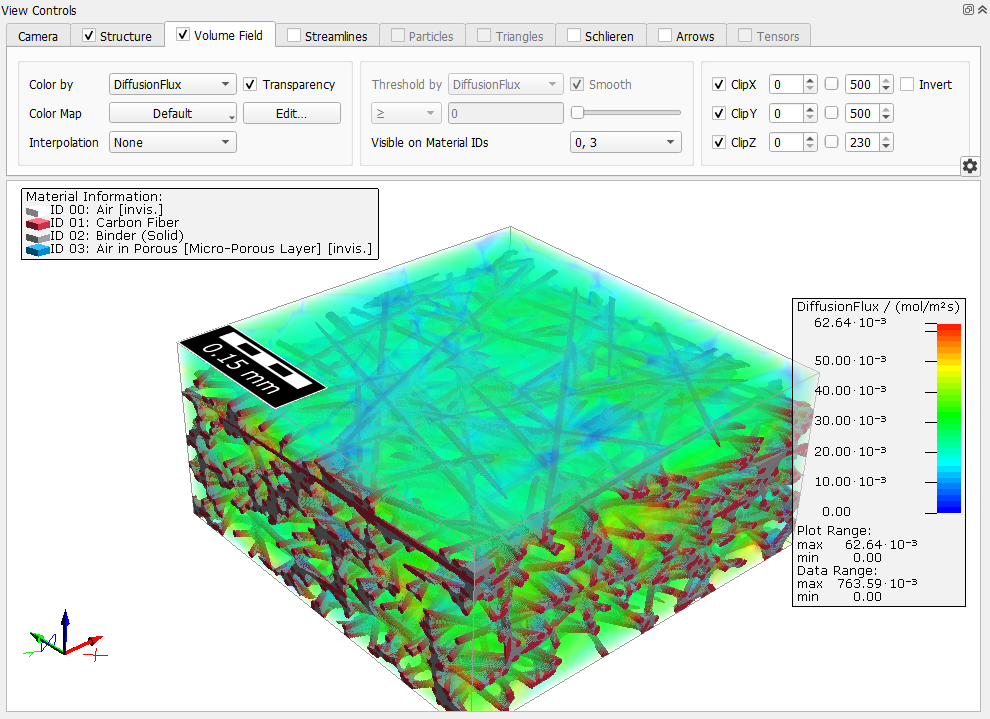
Besides the concentration, the diffusion flux can be visualized as result field or, as any other vector valued 3D field, as streamlines or arrow fields.
To better view the concentration or flux also in the porous materials, switch off the visualization of the current 3D structure by unchecking View → Structure in the menu bar. Alternatively, open the Color & Visibility Settings and set all porous materials to invisible. To visualize the result field only inside of the pores or porous materials, uncheck all solids in the Visible on Material IDs drop-down menu. The visualization options are explained in detail in the Visualization chapter of this User Guide.