Data Visualization
Under the Data Visualization tab, for the Bulk (Laplace) Diffusion command, the result of the diffusivity calculations can be loaded and graphically visualized. Computation Directions that were not previously selected were not computed, and, thus, are unavailable for visualization.
The .hht files contain the local concentration in every voxel. If Write Diffusion Flux into Solution File was checked, the result files contain the diffusion flux, too.
After selecting a result file, and clicking Load Results, a pop-up dialog allows to select which of the result fields contained in the file should be loaded for visualization. After clicking OK, the volume field is displayed over the structure in the Visualization area of the GUI.
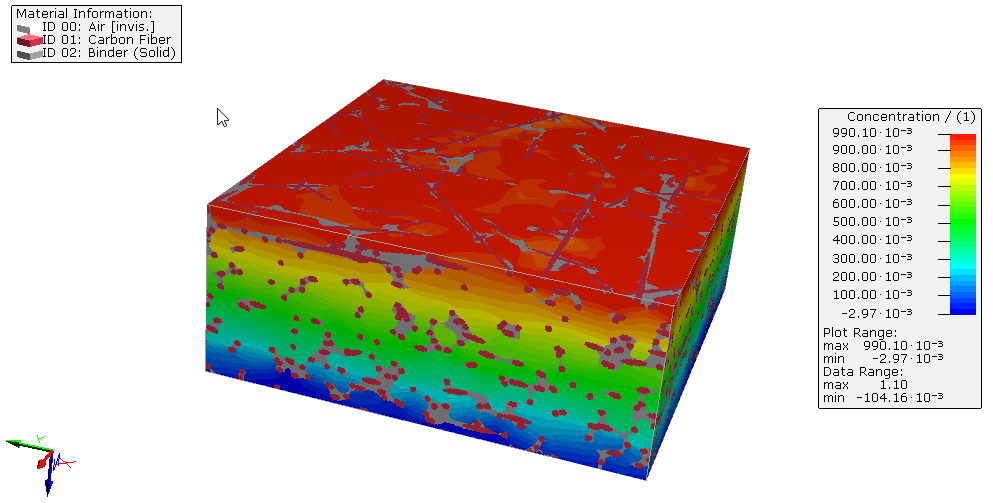
Besides the concentration, the diffusion flux can be visualized as result field or, as it is for any other vector valued 3D field, as stream lines or arrow fields. All visualization options are explained in more detail in the Visualization chapter of this User Guide.